Correlation between currency pairs

Positive correlation

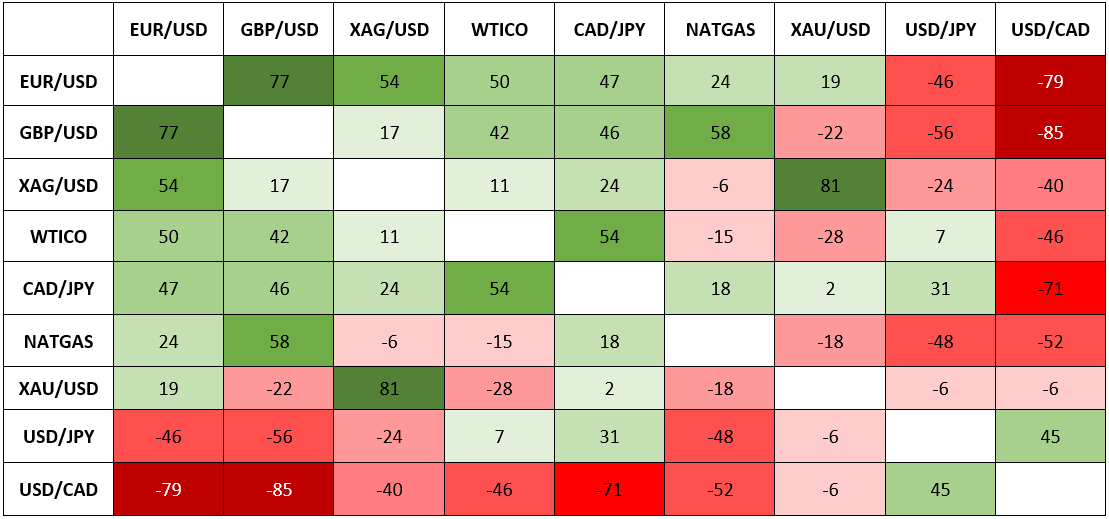
How the correlation between currency pairs works

The correlation between currency pairs is a very interesting topic for investors in the currency market.

Correlation between currency pairs indicates how similarly two currency pairs move in the market.

There are different types of correlation, such as positive, negative and neutral correlation .

For example, the EUR/USD and GBP/USD currency pairs are often positively correlated, meaning they tend to move in the market in a similar way.

On the other hand, the EUR/USD currency pair and the USD/CHF pair are often negatively correlated, which means that when one pair goes up, the other tends to go down. 

Pairs generally moving in the same direction

  • EUR/USD and GBP/USD.
  • EUR/USD and AUD/USD.
  • EUR/USD and NZD/USD.
  • USD/CHF and USD/JPY.
  • AUD/USD and NZD/USD.

Pairs that generally move in opposite directions

  • EUR/USD and USD/CHF.
  • GBP/USD and USD/JPY.
  • USD/CAD and AUD/USD.
  • USD/JPY and AUD/USD.
  • GBP/USD and USD/CHF.

_____________________________

Questions about trading? Try AI, Artificial Intelligence
(Robot bottom right)

Below you can see the brokers most used by our traders.  they have been selected based on the number of registrations and trading operations. In addition to these, you can view the complete list of brokers with relative comparison.

Go to the list

Visit our Italian website ForzaForex.it (translator option in many languages) full of free indicators, strategies and unique resources!

By registering through these links you get preferential assistance, various free resources and the possibility of free access to the VIP signal room. Clear cookies before visiting a broker. Send your ID, teh identification number that the broker assigns you, to info@freebinaryoptions.one.

Risk warning: "Binary options are not promoted or sold to retail EEA traders" If  the broker is not authorized in your area, e.g. IQ Option  (Eurozone / Usa), you can choose from our Broker Comparison (reliable brokers who accept traders from all over the world, following image):


What is the “Swing Trading”?

Swing Trading: The useful strategy for beginners and experts

You will know that brokers offer trading strategies from time to time through their newsletters.

Of course brokers are always biased, but often their information can be used to our advantage by stripping it of superfluous bits.


This time we talk about ” Swing Trading “, a technique useful for beginners but also for experienced traders.

What is Swing Trading?
With this technique the trader tries to capture the market swings as the price of the asset fluctuates over short, intermediate or long-term time intervals. Compared to “Day Trading”, in swing trading operations can be opened and closed within a limited period of time.

High and low swings


To anticipate swings, the trader often uses technical analysis. Analyzing price charts and patterns can help you identify early signs of potential swings and catch the optimal time to enter a trade.

You can use a variety of different tools for technical analysis.


Here are some basic technical analysis tools you can consider for your swing trading approach.

  • The Moving Average (MA): A popular tool for identifying trend direction.
  • The patterns of the candles : the combinations of the candles form an upward or downward pattern.
  • The convergence divergence of oscillatory indicators, such as Stochastics, MACD, RSI. A powerful indicator for spotting emerging trends.
  • Fibonacci retracements : horizontal lines used to determine support and resistance levels.
A candlestick chart with the application of the Fibonacci indicator

_____________________________

Questions about trading? Try AI, Artificial Intelligence
(Robot bottom right)

Below you can see the brokers most used by our traders.  they have been selected based on the number of registrations and trading operations. In addition to these, you can view the complete list of brokers with relative comparison.

Go to the list

Visit our Italian website ForzaForex.it (translator option in many languages) full of free indicators, strategies and unique resources!

By registering through these links you get preferential assistance, various free resources and the possibility of free access to the VIP signal room. Clear cookies before visiting a broker. Send your ID, teh identification number that the broker assigns you, to info@freebinaryoptions.one.

Risk warning: "Binary options are not promoted or sold to retail EEA traders" If  the broker is not authorized in your area, e.g. IQ Option  (Eurozone / Usa), you can choose from our Broker Comparison (reliable brokers who accept traders from all over the world, following image):


MACD STOCHASTIC TURBO STRATEGY

Scalping Strategy M1 / ​​M5 with Macd and Stochastic

If you prefer trading with minimum risk and short deadlines, here is a simple scalping strategy suitable even for the less experienced, the Macd + Stochastic turbo strategy.

You probably already use an indicator, perhaps one popular among traders such as the Macd or the Stochastic.  Why not use two of them together to improve results? Maybe adjusted for M1 or M5 time frames, that is, for the very common short-term scalping.

Here is the strategy we have prepared for you. You can use it with the help of any 1 minute or 5 minute chart , and any currency pair .

The strategy uses the two indicators already present as standard on most platforms, so to get started you just need a good demo for testing that already has the two indicators available. Otherwise you can rely on the good old metatrader.

The graph with indicators

  • Indicators:  MACD (Moving Average Convergence / Divergence). Parameters: 12,26,2
  • STOCHASTIC (Slow Stochastic). Parameters 8,3,3  
  • Recommended time frame: M1 and M5
  • Currency pair: Any
  • Recommended deadline: 5/6 minutes for M1, 25/30 minutes for M5

Macd Stochastic Strategy Chart (EUR / USD M1)

Macd Stochastic Strategy Chart (EUR / USD M1)

Entry Rules Strategy

BUY (Buy / Call)

  • MACD> 0 (greater than zero)
  • STOCHASTIC crosses (coming from below) level 20

SELL (Sell / Put)

  • MACD <0 (less than zero)
  • STOCHASTIC crosses (coming from the top) level 80

Trading examples

Example 1. Call.

The Eur Usd M1 chart (the same as the one shown above) shows us a possibility of entry into Call , as the macd is above zero and the stochastic rises from level 20.

Macd is above zero and the Stochastic rises from level 20

Macd is above zero and the Stochastic rises from level 20. CALL

Example 2. Put.

Eur / Usd M1. Here we have identified a point where the macd is below zero and the stochastic falls from the 80 level. Put.

macd is below zero and the Stochastic drops from the 80 level. Put.

Macd is below zero and the Stochastic drops from the 80 level. Put.

Example 3. Put

Again a similar example, Macd <0 and Slow Stochastic falls from the 80 level. Put.

Macd <0 and Slow Stochastic drops from level 80. Put.

Macd <0 and Slow Stochastic drops from level 80. Put.

Example 4. Call

MACD> 0, and the Stochastic rises from level 20, Call.

MACD> 0, and the Stochastic rises from level 20, Call.

Example 5. Two Call.

MACD> 0, and the Stochastic rises from level 20, Call.

MACD> 0, and the Stochastic rises from level 20, Due Call.

Example 6. No Trade.

There is no correspondence between Macd and Stochastic. No trade.

MACD> 0, and the Stochastic drops from level 80. No Trade

MACD> 0, and the Stochastic drops from level 80. No Trade


KEEP THE STRATEGY IN A CONVENIENT PDF VERSION

You will have the opportunity to consult it during your trading sessions


MACD STOCHASTIC PDF STRATEGY


_____________________________

Questions about trading? Try AI, Artificial Intelligence
(Robot bottom right)

Below you can see the brokers most used by our traders.  they have been selected based on the number of registrations and trading operations. In addition to these, you can view the complete list of brokers with relative comparison.

Go to the list

Visit our Italian website ForzaForex.it (translator option in many languages) full of free indicators, strategies and unique resources!

By registering through these links you get preferential assistance, various free resources and the possibility of free access to the VIP signal room. Clear cookies before visiting a broker. Send your ID, teh identification number that the broker assigns you, to info@freebinaryoptions.one.

Risk warning: "Binary options are not promoted or sold to retail EEA traders" If  the broker is not authorized in your area, e.g. IQ Option  (Eurozone / Usa), you can choose from our Broker Comparison (reliable brokers who accept traders from all over the world, following image):


Moving Average Strategy

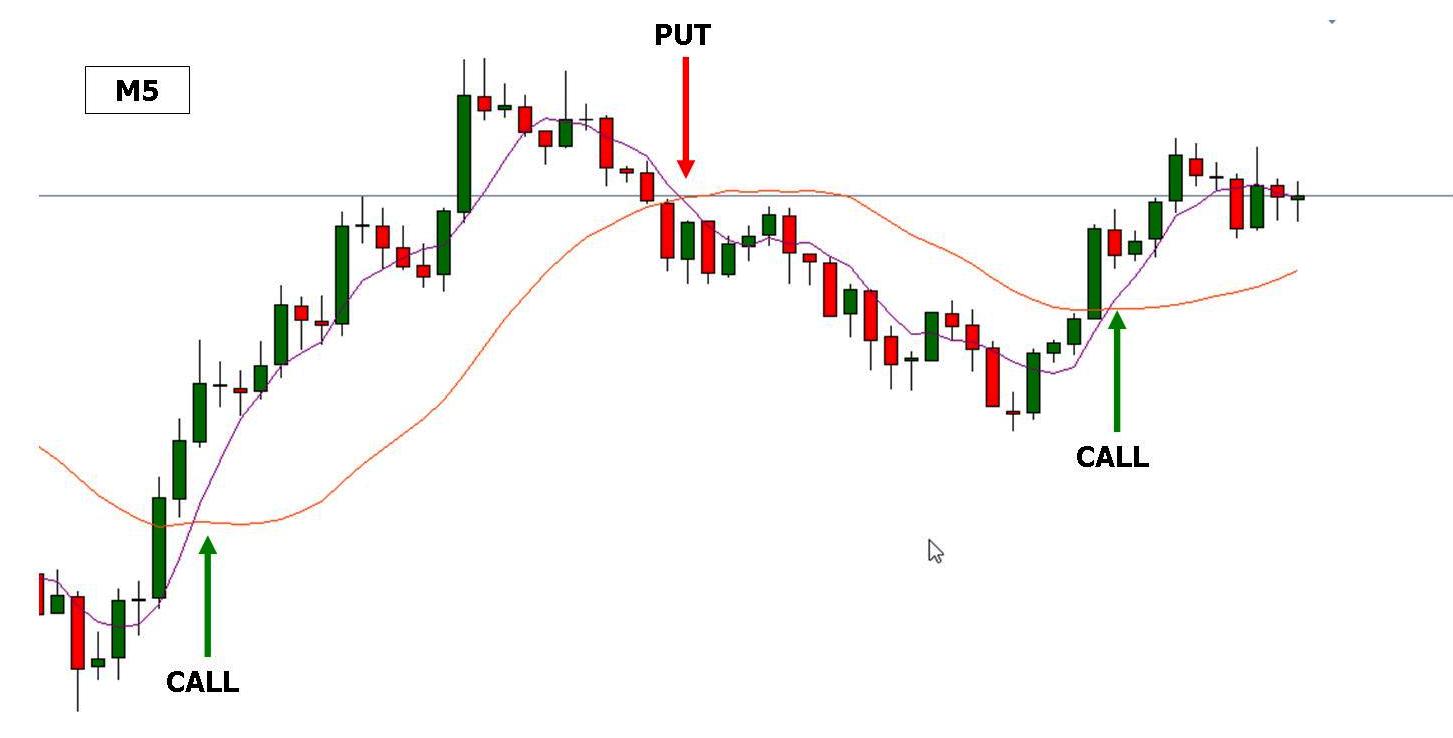
The Moving-Average Crossover Strategy

The Moving Average crossover strategy is of vital importance for any beginner simply due to its straightforward and proven effectiveness. Even for traders learned and experienced through a myriad of other various systems, some of which complex, can find solidarity in returning to this simple system of immediate use, appreciated by any investor.

With the right settings, the crossover strategy will give you excellent results:

  • When to enter
  • What settings
  • Which time frame
  • What deadline
  • What amount to invest
  • Which currency pair


Moving Average crossover strategy


Also recall that the key to a strategy often works consistently in its simplicity.

This strategy of moving averages is based on a contemporary of two Moving-Averages in order to obtain more reliable signals. Furthermore, the call cross strategy of moving-average will be used as an average of “slow” and a fast “, which will meet at some points (” crossover “).

Moving Average crossover strategyUsing this system is quite simple, since the characteristics of the two averages are similar and differ only in the period.

Recall that a moving-average shows us, candle to candle, the average price calculated over a period of N candles, where N is the period specified in the indicator settings.

These averages can be used in different time frames, in this case we will focus on the M5 time frame, lasting five minutes for each candles, indicated for short maturities.

Moving Average Crossover Trading System. Setting Moving-Average Indicators

The fast moving-average is regulated over a period of 5 candles, one slower one over a period of 20 candles.

This allows us to obtain curves suitable for the M5 time frame with short deadlines, no more than about 3-4 candles, i.e. in practice maturities of between 15 and 20 minutes.

Installation Indicators

To start we need to view these moving-averages. On Metatrader 4 you can follow the path shown:

Install Moving Average on metatrader4

Here’s a settings example:

Settings moving average indicator


Some brokers have the moving average already supplied, directly accessible from their menu:

Moving Average Iq option set up

Entry into the trade

Our trading signal will be given by the intersection of two moving averages, and more precisely from the intersection between the faster moving average and the slow.

When the faster moving-average (shown in purple) crosses the slow moving average from the bottom up, we will have a possible ascent of prices, i.e. a buy signal, Call.

On the contrary, when the fast moving average crosses the slower moving average (depicted in orange) from the top down we will have a possible drop in prices, then, a Put signal.

It is also advisable not to go before the closing of the current candle:

entry point crosover strategy

Money Management

The Moving Average Crossover Strategy, for its simplicity, is also given to those who began working for the first time in binary options, as long as you comply with the basic rules of capital and control.

Since not all input signals will be given a positive result, we recommend investing only a small part of the total capital for each transaction to reduce risks, that percentage should not exceed 5% of the total.

Expiration Time

As already mentioned, in this system that employs M5, the deadline will be between 15 and 20 minutes.

For different time frame, the rule of 3-5 candles, i.e. a maximum of 5 minutes to M1, M15 and so on for about an hour.

Currency Pair

It’s good use very traded currencies, also in relation to open markets at that time. EUR/USD for example, valid currency pair during the London and New York sessions.

To end one more example, this time from a screen of IQ Option. Put, red arrow. Call, green arrow.

Iq option crosssover strategy Call Put


_____________________________

Questions about trading? Try AI, Artificial Intelligence
(Robot bottom right)

Below you can see the brokers most used by our traders.  they have been selected based on the number of registrations and trading operations. In addition to these, you can view the complete list of brokers with relative comparison.

Go to the list

Visit our Italian website ForzaForex.it (translator option in many languages) full of free indicators, strategies and unique resources!

By registering through these links you get preferential assistance, various free resources and the possibility of free access to the VIP signal room. Clear cookies before visiting a broker. Send your ID, teh identification number that the broker assigns you, to info@freebinaryoptions.one.

Risk warning: "Binary options are not promoted or sold to retail EEA traders" If  the broker is not authorized in your area, e.g. IQ Option  (Eurozone / Usa), you can choose from our Broker Comparison (reliable brokers who accept traders from all over the world, following image):


SR Arrows Breakout Indicator Download

SR Arrows Breakout Indicator Free Download

This “SR Arrows Indicator” displays support and resistance levels with an arrow to appear at the breakout, i.e. after the candle has crossed the line. A simple and useful tool.

The SR Arrows Indicator (Support and Resistance with arrows)
The SR Arrows Indicator (Support and Resistance with Arrows)

Who is the trader who does not use static resistance and support levels?

This “SR Arrows Breakout” indicator, complete with explanations for use, displays the SR levels and makes an arrow appear at the breakout, that is after the candle has crossed the line.

The indicator gives the possibility to adjust the “strength” of the support or resistance, for example by eliminating the less important levels. It also has additional filter functions based on common oscillator, RSI and CCI indicators (with settings).

You can choose whether to be notified on exceeding the level or on an actual breakout. A simple and useful tool to get good positive percentages!

 The free indicator gives the possibility to adjust the “strength” of the support or resistance, eliminating, for instance, the least essential levels. It also has additional filter functions based on common oscillator indicators (RSI and CCI).

You can choose whether to be alerted to exceed this level or get an actual breakout.

SR Arrows Inputs Settings

The indicator can be used for any type of trading and any type of counters/pairs, and the interface of the indicator is very simple to use.
The settings are customizable. You can trade Scalping, Short Term or Long Term.

SR Arrows is the most efficient way to Trade Manually or or inserted in an automation system such as MT2 (thanks to the arrows+pop-up).

SR Arrows is one of the best indicator for MT4.

If you sign up with one of our brokers you will have access to a number of free trading systems, as well as access to the Signals Room.

If you are in a non-European country we recommend you to try the indicator on IQ OPTION.
(Signing up as our affiliate, you will receive exclusive free strategies+indicators and access to the Signal Room. Delete the cookies before visiting the broker)


SR ARROWS BREAKOUT INDICATOR DOWNLOAD

_____________________________

Questions about trading? Try AI, Artificial Intelligence
(Robot bottom right)

Below you can see the brokers most used by our traders.  they have been selected based on the number of registrations and trading operations. In addition to these, you can view the complete list of brokers with relative comparison.

Go to the list

Visit our Italian website ForzaForex.it (translator option in many languages) full of free indicators, strategies and unique resources!

By registering through these links you get preferential assistance, various free resources and the possibility of free access to the VIP signal room. Clear cookies before visiting a broker. Send your ID, teh identification number that the broker assigns you, to info@freebinaryoptions.one.

Risk warning: "Binary options are not promoted or sold to retail EEA traders" If  the broker is not authorized in your area, e.g. IQ Option  (Eurozone / Usa), you can choose from our Broker Comparison (reliable brokers who accept traders from all over the world, following image):


Trend Strategy

A strategy based on trend that can give great satisfaction to the trader.

Looking at the performance of prices in various charts, especially those with higher time frames, it is not difficult to visually detect the direction of the market.

This allows us to recognize the trend and use it for our inputs. If you are already use a trading system, it is often indispensable to only filter those signals that correspond to the direction of the market, in order to reduce the negative cases.

follow the trend

Trend Strategy Inputs

A strategy based on trends cannot simply tell us to enter Call when the trend is positive and Put when it’s negative, even if that’s the basic concept.

Because even a well-defined trend, there are always fluctuations, the trader may, after establishing the direction of the trend, wait a reverse swing and proceed with the direction previously determined. That is all fine and dandy provided that such a trend does not betray in such a moment!

Remember our old saying

“The trend is your friend… while it lasts.”

In the featured image , the positive trend is quite defined, but if we decide to head right at the dotted line, we will not be certain of the outcome.

Bull market changing direction trend

There are techniques to identify the trend through the use of indicators, the direct observation of prices, or the analysis of different time frames. Several traders will each have their own approach to the problem.

In all cases the following rules are valid:

You can pursue the current trend only if you are able to determine it correctly.

A currency pair which follows a certain trend in the time frames to 5 minutes, may in fact be followed by a reverse in the one to 30 minutes, for example.

Even if I meet the coincidence, you should still be aware of how reliable your assessment of that particular trend is.

We’ve explained in the Moving Average Strategy a system that is useful for determining the direction to take. This article on the trend completes it with important rules.

The “set-up” we recall here briefly, and builds its two regulated mobile medium on a period of 5 and the other on a certain period of 20.

entry point moving average crossing

Buy when the orange line drops below the purple and sell when the orange exceeds the purple uphill.

This is easy to also those who have started trading the first time. The system’s effectiveness is greater with inputs based on the direction of the trend.

Correctly determinating the direction of the trend, however, is not as intuitive as it may seem, and in this article we will focus on this important aspect. Once we establish the direction of the market, “filter” our inputs depending on the trend.

So here we complete the rules of entry (the first two have already been described in the previous “Strategy moving averages” article)

1. Buy when the orange line drops below the purple and sell when the orange exceeds the purple uphill.

2. Wait for the closure of the crossing candle.

3. Be faithful to the direction of the trend.

In case of an indefinite trend, suspend trading.

How to determine the trend correctly?

The trend can be determined by observation of the graph, even without indicators, as the human eye in this case exceeds any technical instrument.

However, it should avoid common mistakes. Let’s see how.


 trend analysis

Trend Analysis: Trendlines

To determine a trend, use the trendlines, and learn to draw them correctly.

Just draw a trendline connecting highs with highs (or lows with lows) and its inclination leads us to identify the trend.

To get started, locate a price change and utilize the maximum or minimum as the basis of the tracking start, as if it were a hinge marking the changing trend (pivot point or pivot line, line connecting the pivot points).

That’s a trend line that connects four highs, that is, the upper parts of the swing prices. These highs are descending and the trend is clearly negative.

trendline

Remember that a trend line remains all the more stronger and valid with every possible points marked.

A trend line connecting only 2 points is easy to find but far less effective:

trendline between two points


So in this particular case to establish that the trend is positive is inappropriate.

Another aspect to note is the distance between two points. If you are too close to the trendline it is less valid:

trendline between nearest point


Conclusion

Drawing a trendline correctly allows us to determine the market trend and enter the trade only in a certain direction, filtering our inputs to maximize winnings.

Trendline breakouts, geometric shapes formed by the trendlines etc. are not part of this article.

Test these tricks and inform us of your experiences here at info@freebinaryoptions.one

_____________________________

Questions about trading? Try AI, Artificial Intelligence
(Robot bottom right)

Below you can see the brokers most used by our traders.  they have been selected based on the number of registrations and trading operations. In addition to these, you can view the complete list of brokers with relative comparison.

Go to the list

Visit our Italian website ForzaForex.it (translator option in many languages) full of free indicators, strategies and unique resources!

By registering through these links you get preferential assistance, various free resources and the possibility of free access to the VIP signal room. Clear cookies before visiting a broker. Send your ID, teh identification number that the broker assigns you, to info@freebinaryoptions.one.

Risk warning: "Binary options are not promoted or sold to retail EEA traders" If  the broker is not authorized in your area, e.g. IQ Option  (Eurozone / Usa), you can choose from our Broker Comparison (reliable brokers who accept traders from all over the world, following image):


Hi! I'm AI, Trading Artificial Intelligence ✌️ I'm still learning about this new job, but I hope I can help you!
AI Chatbot Avatar