
Support and Resistance: let’s make use of them!

horizontal levels of support and resistance
Many already know what support and resistance levels are, but often used simply as reversal zones they lead to disappointing results. We must be clear if and when they can be used to open a position.
So let’s read the following topics to use the SR levels for our openings the supports and resistances:
- What are support and resistance (SR)
- When support or resistance forms
- How to determine support and resistance levels
- What to do after plotting SR levels
- Trend lines for entry confirmations
- Moving average as support or resistance
- Fibonacci retracement as support and resistance
- Ichimoku Cloud to identify reversals
What are support and resistance?
Support and resistance are key levels on a price chart where buying and selling pressure are in balance, causing the price to bounce off or above the level . These are horizontal price levels commonly established by linking the highs of the price bars to other highs or lows to lows.
Support and resistance levels are important technical tools used in trading to identify possible points where the market could reverse its direction.
Below are a few ways you can use them to make trading decisions.
1. Identify support and resistance levels . The first step is to identify support and resistance levels on the price chart. Support levels are the points where the price has found support in the past and found it difficult to fall further. Conversely, resistance levels are the points where the price has found it difficult to move higher and has found resistance in the past .
2. Use support and resistance levels to make trading decisions . When the price approaches a support level, one can consider buying, as the idea is that the price will find support and start moving up. Conversely, when the price approaches a resistance level, one can consider selling, as the idea is that the price will find resistance and start falling.
3. Confirm support and resistance levels with other technical tools . You can confirm support and resistance levels with other technical tools, such as Fibonacci levels, moving averages or pivot points. This can increase the probability that the support or resistance level will behave as expected.
4. In forex. Use support and resistance levels as stop loss points . The support and resistance levels can also be used as stop loss points to limit losses in case the price moves against the open position.
In general, support and resistance levels are a useful tool for identifying possible market turning points . However, it is important to keep in mind that support and resistance levels are not accurate indicators and the price may cross or break support and resistance levels unpredictably.
Support and resistance levels are critical technical indicators that form the basis of a wide range of technical analysis tools. Traders determine support and resistance in price action to identify ideal price points to buy and sell assets .
Support and resistance are the most essential trading indicators , helping you to eliminate most of the guesswork and identify potential trading opportunities.

When support or resistance forms
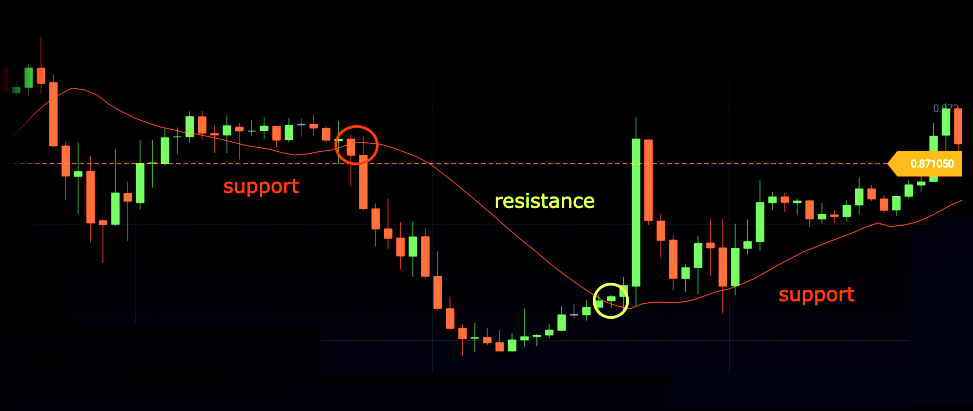
A support or resistance level is formed when the market’s price action reverses and changes direction, resulting in the formation of a peak or trough (swing point) .
Support is a level on the trading chart beyond which an asset’s price will not fall or fall and bounce. It acts as a floor which limits any further downward movement . At this point, buyers are more likely to buy an asset and sellers are reluctant to sell, leading to increased demand and consequently an increase in the asset’s price .
Conversely, resistance is a level where the price struggles to break through to the upside and is pushed back down again. Resistance is a price point where the asset has high supply and lower demand, lowering the asset’s price and preventing further price increases. It acts as a ceiling, limiting further upward movement in prices.
How to determine support and resistance levels
To take out some of the uncertainty that comes with trading, traders should always consider an asset’s support and resistance levels before entering a trade .
Trends and Trend Lines
A trader must first identify key support and resistance levels with the use of several technical indicators. The most common way to identify support and resistance is through price action, looking for highs and lows over specific periods . These levels could be recent swing highs or lows or significant price points such as round numbers or psychological levels. Traders use the line graph tool to connect the highs and lows and draw lines accordingly.
Trendlines are another graphical tool that can be used. These lines connect two or more price points on a chart , making it fairly easy to use. In an uptrend, the trendline acts as a support level, while in a downtrend, the trendline acts as a resistance level.
Use moving averages
Another way is to use the 10-day, 20-day, 50-day, 100-day or 200-day moving averages to identify support and resistance levels . The moving average can act as a support level when the price is above it; conversely, the moving average can act as a resistance level when the price is below it.
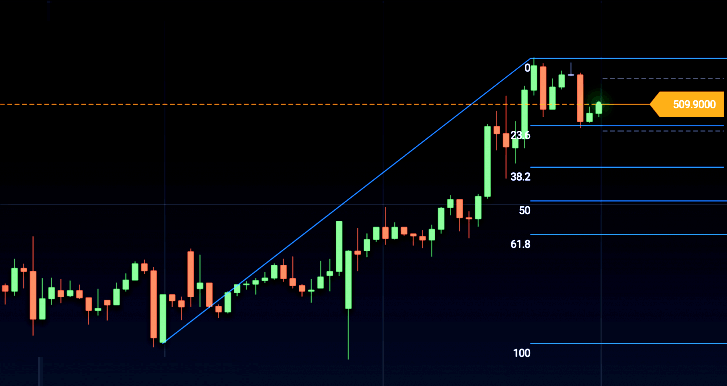
Fibonacci retracement as support and resistance
Fibonacci retracement is another technical analysis tool used to identify potential support and resistance levels. It is based on the Fibonacci sequence, introduced by the Italian mathematician Leonardo Fibonacci. The Fibonacci sequence is a series of numbers where each number is the sum of the previous two numbers, starting with 0 and 1. These levels are drawn using horizontal lines to mark the percentage retracement levels between the highest and lowest points of a market.
Fibonacci retracement levels are used to determine potential support or resistance levels . This can help identify key areas where traders could enter or exit positions, as well as potential stop loss levels to manage risk.
Ichimoku Cloud
The Ichimoku Cloud, also known as Ichimoku Kinko Hyo, is a technical analysis tool used to reveal overall trend strength and direction . Ichimoku helps identify potential trend reversals and momentum shifts in the market.
The Ichimoku Cloud indicator is composed of several elements, including the Conversion Line (Tenkan-sen) (9 periods) and the Standard Line (Kijun-sen) (26 periods) which act as dynamic support and resistance lines. While this indicator may seem a bit complicated, it’s not difficult to understand and can prove to be extremely useful.
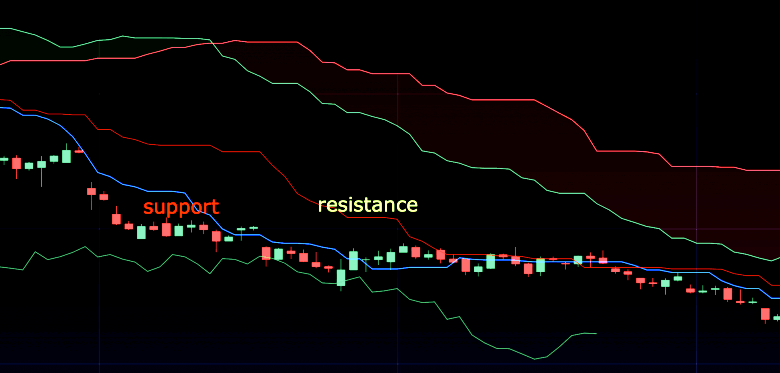
Traders often use Ichimoku support and resistance levels in conjunction with other technical indicators such as Relative Strength Index (RSI), Moving Average Convergence Divergence (MACD), and Bollinger Bands to further confirm received signals and improve the accuracy of their trades.
How to open a trade
Once the support and resistance levels are confirmed, traders need to analyze the price action around these levels.
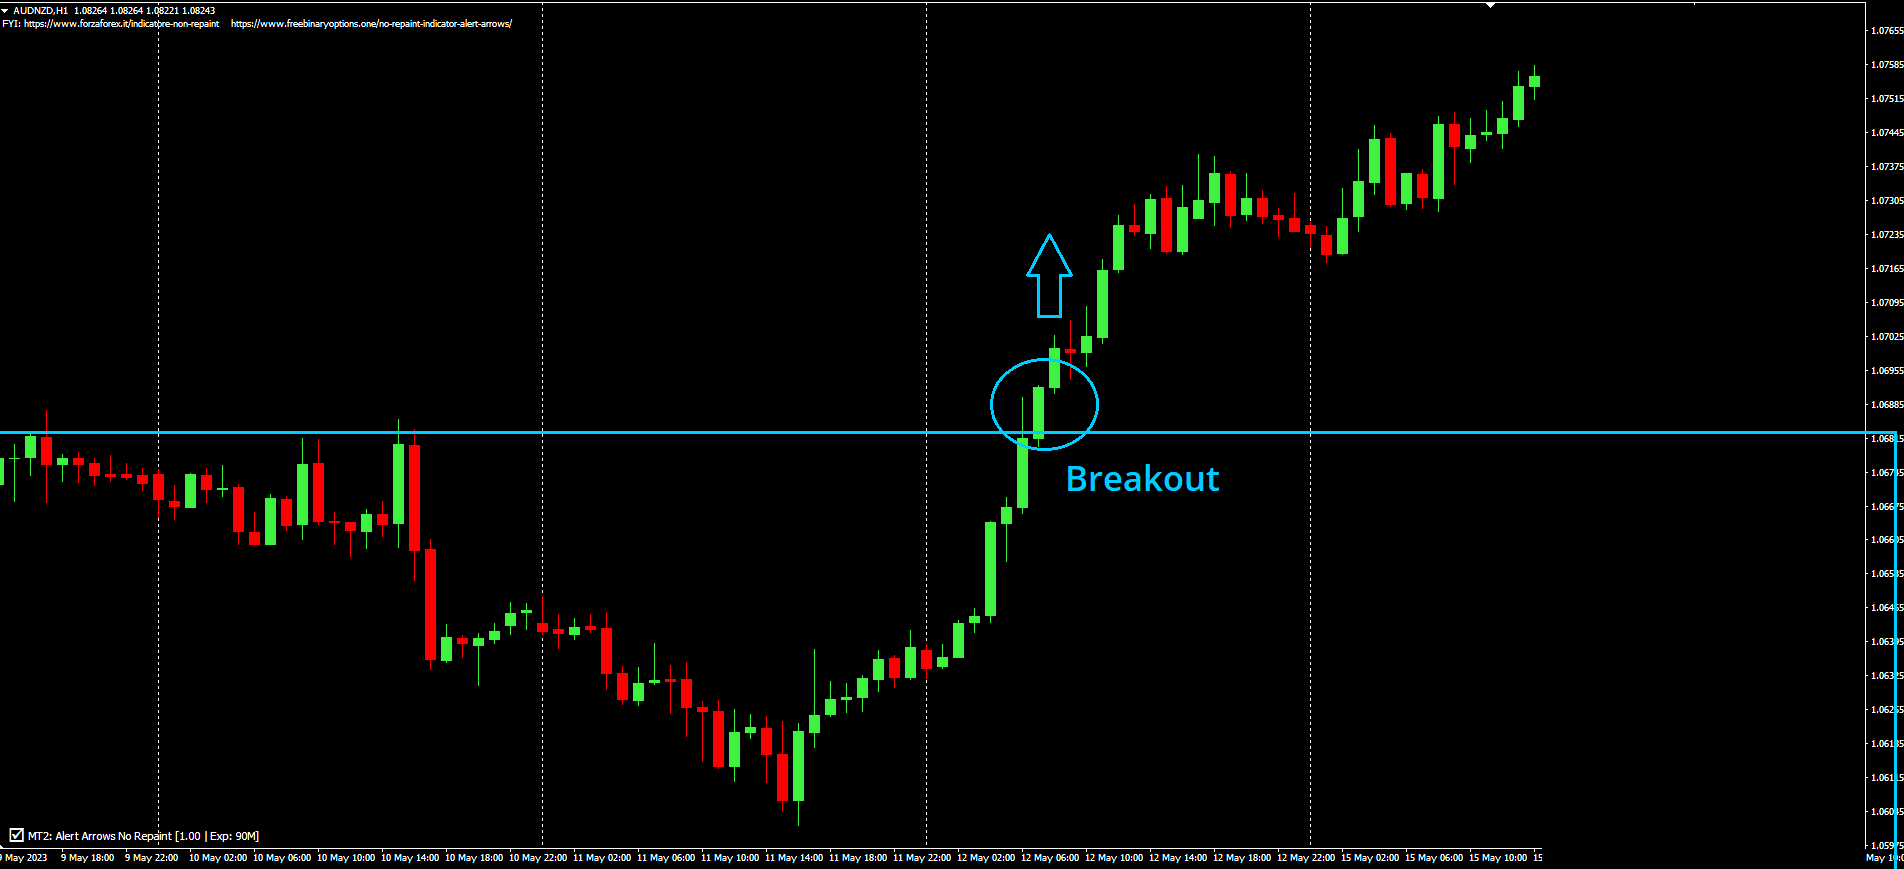
If the price breaks above resistance or falls below support, it could indicate a potential trend reversal or continuation.
Support
- To enter a long position (“Buy”), a trader can open a trade just above the support level after a bounce . In forex to minimize potential losses in the event of a downtrend reversal, a trader can set a stop-loss order just below the support level when placing a buy order.
Resistence
- In short selling (“Sell”), a trader needs to pay attention to the resistance level . Short positions can be entered just below resistance levels, with the expectation of a price decline. The stop loss can be set just above the resistance level.
Support and resistance on Pocket Option and Quotex
Pocket Option and Quotex are online trading platforms that offer multiple financial instruments, including forex, stocks, commodities and cryptocurrencies. ea platforms provide a rich set of technical analysis tools, such as the ones mentioned above. Alternatively you can use Metatrader as a graphical reference.
These brokers with their charting tools help identify SR levels where the market is likely to experience buying or selling pressure. It works by drawing horizontal lines on the price chart, indicating levels where the market has previously encountered support or resistance.
The trader can manually plot his own support and resistance levels with these tools to monitor how the market reacts as prices approach those levels.

Do you want to learn more about the topic? Here is the Support and Resistance Strategy with a free indicator:
Conclusion
Support and resistance levels are important tools for identifying potential trading opportunities and managing risk. Understanding and applying support and resistance levels can significantly improve a trader’s chances of success.
Don’t hesitate to practice using these indicators in your demo account to maximize your profits.