
Candlestick patterns (or figures) are popular tools for asset analysis. By looking at different patterns, traders can spot potential trend reversals and choose the optimal time to enter or exit a trade.
There are tons of candlestick patterns, as you will know if you’ve done some research, and this could get confusing. You’ve probably desisted from using them.
We try to be practical, limiting ourselves to some that are considered more effective, accompanied by some examples to understand how to use them in trading.
Let’s start from the basics to review the main concepts.
What is a candle in trading
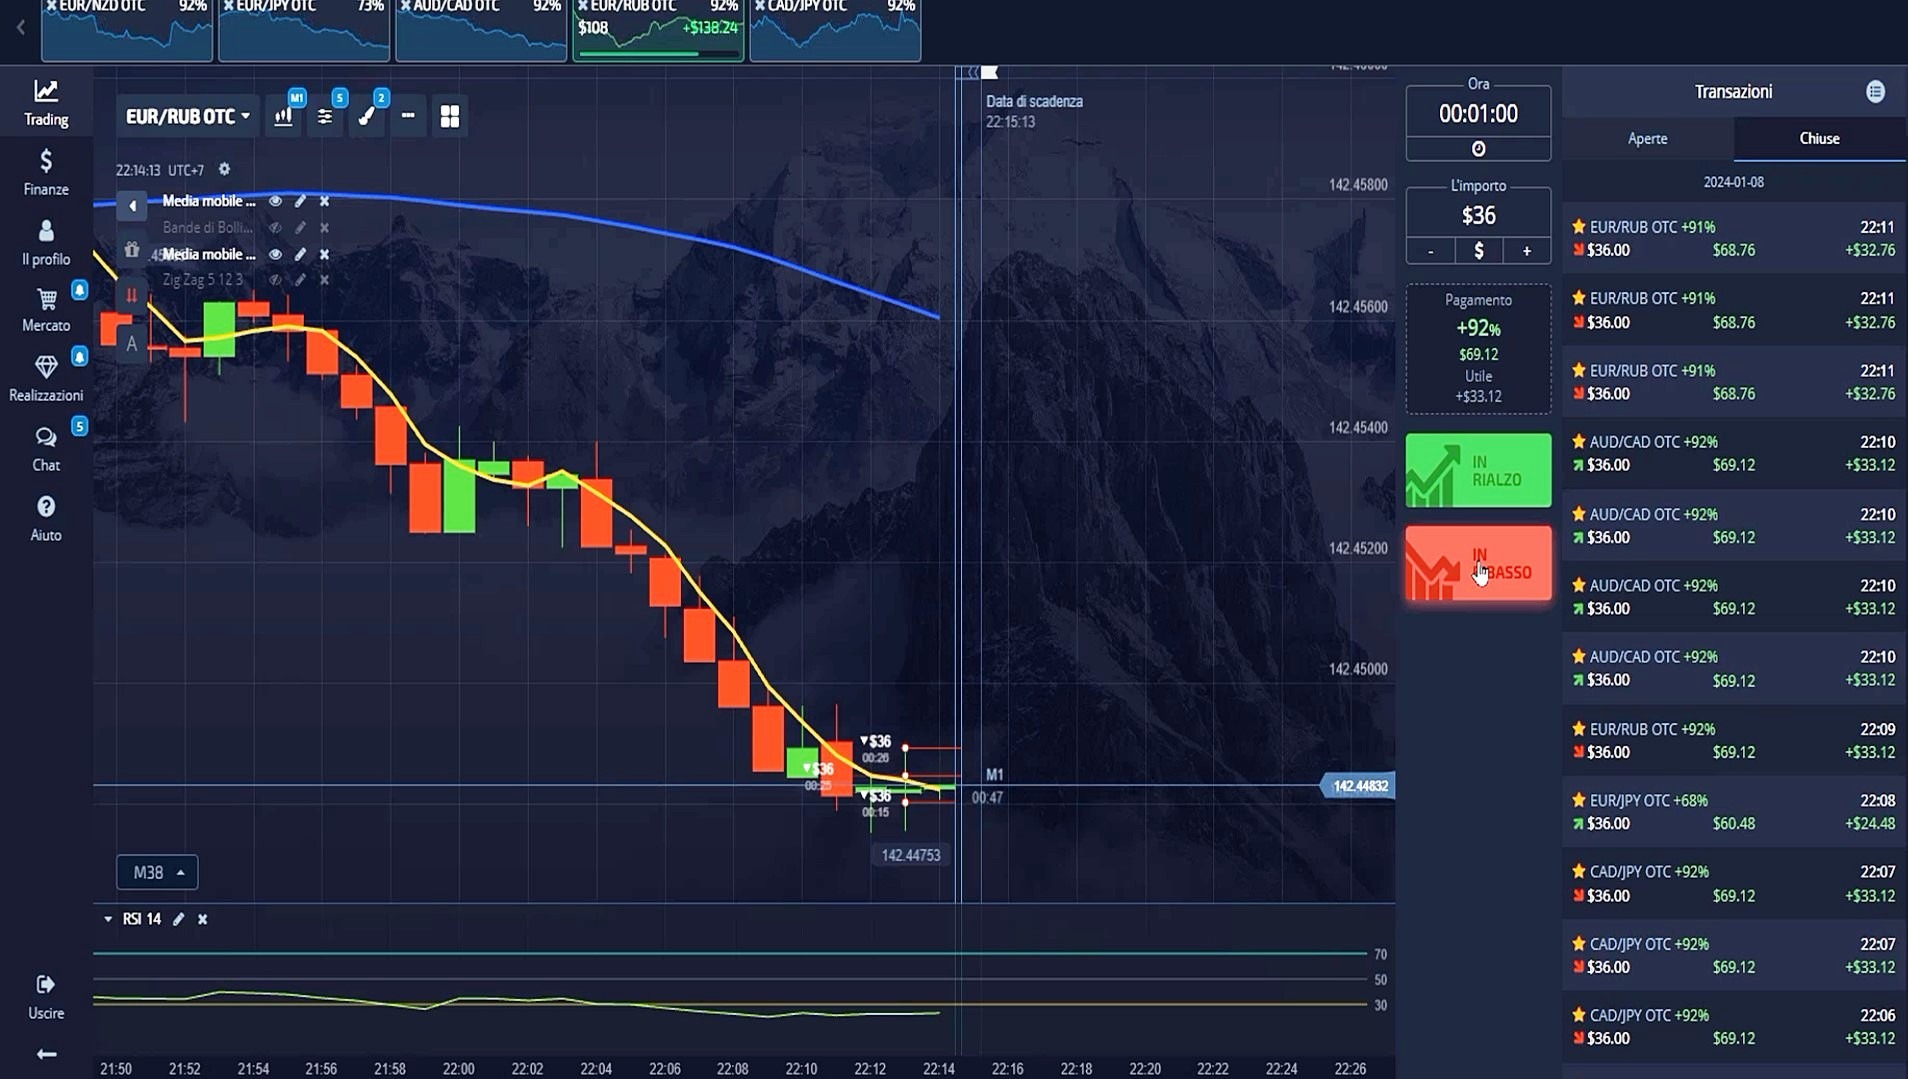
Candlestick patterns are formed by a combination of candlesticks , displayed in the charts of the trading platform.
The main parts of the candle are the body , the upper shadow and the lower shadow.
The body of the candle indicates whether the closing price is higher (green candle) or lower (red candle) than the opening price . In some platforms, such as Metatrader for example, the colors of the candles can be changed according to your preferences

A candlestick shows the price changes of an asset (e.g. Eur/Usd) over a certain period of time. For example, if a trader chooses the 15 minute period, a candlestick will show data for the last 15 minutes.
The candle’s shadow displays the highest and lowest prices touched during this period.
Candlestick patterns for trading
Candlestick trading involves identifying candlestick patterns and possibly using them to understand market behavior. Since there are numerous patterns, here are the main ones to get you started.
The hammer
It is a bullish pattern that could indicate an imminent trend reversal. It could appear in the final stage of a downtrend and indicate the lowest price before a bounce.
When a candlestick’s lower shadow at the end of a downtrend is at least twice as long as the body , a hammer pattern can be observed.

To confirm the pattern, the next candlestick should close above the body of the previous candlestick.

.This approach is not 100% accurate, so traders should consider the potential risks carefully before making their move. To get further confirmation of the trend reversal when trading candlestick patterns, you can apply some technical indicators, such as the MACD or RSI .
Pattern Engulfing
Two types of patterns depending on whether the trend is down or up.
BEARISH ENGULFING PATTERN
This pattern can occur at the end of an uptrend and indicate the following price decline . It is a long red candle enclosing a smaller green candle that preceded it.

You can evaluate how long the red candle is compared to the green one.
If this contains the entire body of the previous candle, it may be sufficient to indicate a probable trend change. However, if it breaches not only the body of the green candle but also its upper and lower shadows, it could be a sign of an impending strong trend reversal.
BULLISH ENGULFING PATTERN
Similar to the bearish pattern, this one is formed by a larger candle engulfing the previous smaller one. In this case, at the end of a downtrend, the first red candle appears. The second one is green and should cover the entire body of the previous candle.

The bullish engulfing pattern could indicate an impending trend reversal , which could present potential trading opportunities. However, as with any technical analysis tool, there is no guarantee that the prediction will come true. For this reason it is good to seek further confirmations.
Harami
To remember the pattern, the meaning of the name that comes from the Japanese word meaning “pregnant” comes in handy because the graphics it shows resemble a pregnant woman.
HARAMI BEARISH
This pattern consists of a small red candle following a larger green candle . It doesn’t provide much insight into the direction of a potential trend reversal. However, it could indicate an impending change in direction.
If the price continues to rise after observing this pattern, the uptrend could last. Conversely, if the Harami pattern is followed by a bearish candlestick, the price may continue to fall.

HARAMI BULLISH
Traders can see this pattern in the late stages of a downtrend when a large red candle is followed by a smaller green one. Like the bearish Harami, it can indicate two possibilities: the continuation of a downtrend or a potential reversal. To confirm the reading, traders should pay attention to the candle following the pattern. Whether it continues to rise or fall, it could indicate a lasting trend or a possible reversal.

i. It happens that some traders tend to overlook them, assuming that the recent direction will continue shortly and not expecting major changes. So if a reversal bounce occurs , it may be sudden. To keep in mind.
Three white soldiers
This pattern consists of three long bodied green candlesticks following a downtrend. They appear one after another.

If you observe this pattern, it could offer an opportunity to take a bullish position . To get more precision, traders can use the three white soldiers pattern in conjunction with other technical tools, such as trendlines and indicators.
Three Black Crows
This is called the opposite pattern with 3 red candles.
Some time ago we also created a strategy on this pattern of the Three Black Crows which also deals with the case of the Three White Soldiers.
Three Inside Up
It is a bullish reversal pattern that consists of a combination of three consecutive candlesticks. The first is a large red candle, the second is a smaller green candle that opens and closes within the body of the first. The third candle is also green, closing above the previous candle.

Three Inside Down
This pattern is the opposite of the previous one, made up of three consecutive candles. In this case, a large green candlestick is followed by a smaller red one, contained within the body of the first candlestick. The pattern is completed by a longer red candle which closes below the second one.

Keep in mind that these two candlestick patterns could be considered short-term and do not guarantee big trend changes. However, they can be useful when looking for price movements that could potentially lead to significant trend reversals .
Does candlestick trading work?
The idea behind this method of technical analysis is that price movements are not random. As a result, traders can spot specific patterns. You can decide to trade candlestick patterns for a variety of assets.
There are a few indicators that traders should pay attention to. For example, when you see a long green candle , this could be an uptrend signal. In the case of a long red candle , it could be the start of a downtrend. However, it is always advisable to use other analysis tools to support these findings , as candlestick patterns alone can be misleading. Traders can use indicators to check their analysis and make an informed decision.
It is also important to remember that candlestick patterns are formed by past and current price swings . This means that they cannot accurately indicate future price changes.
Conclusions
The combinations of candlesticks form patterns that traders can analyze to confirm their predictions of price movements.
Different candlestick patterns can indicate potential trend reversals, bullish or bearish, which can offer trading opportunities.
However, it is preferable to use candlestick patterns in conjunction with other technical tools to get more accurate readings.