
Pullback Bollinger Bands Strategy
Only two indicators with color signal per Exnova, IQ Option, Pocket Option, Close Option and other.
Introduction
Bollinger Bands contain market fluctuations.
Therefore you can think of bands as levels where prices bounce to move towards the opposite band, and open positions accordingly.
Unfortunately, the expected rebound does not always happen and prices are trapped in the same band, until they finally decide to leave it and return to the opposite band.
To complicate things sometimes the price makes a false bounce and then return in the previous direction.
The big question is: “how do you know when prices really rebound?”

Let’s find out in this strategy “Detect the true bounce of the Bollinger Bands”
It is a strategy tested for short deadlines, but can also be used at different times.
Configuration
The strategy applies to any market and any broker.
We use Tradingview for the signal, and your favorite broker for the trade opening.
Trading platform
- Indicatore “The Ultimate Buy and Sale Indicator” Parametri Default
- STC indicator
- 1 minute candles on Tradingview and 5 minute expiry on the broker
Trading platform preparation
To get started, let’s open Tradingview and install the indicators.
If you don’t remember exactly how to do it, here’s a quick tutorial on how to get started:
Let’s install the two indicators foreseen by the strategy with the recommended parameters and customized colors and windows of your choice.
Here are the adjustments.
The first indicator is called “The Ultimate Buy and Sell Indicator”
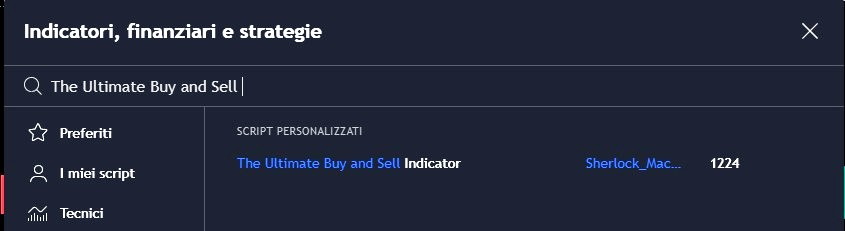
The parameters remain the default ones.
In the style, deactivate all windows except BUY/SELL.

This indicator is based on Bollinger Bands, as can be verified by adding the classic Bollinger Bands indicator to the chart with default settings of 20, 2.
The bands correspond to the color indicator.
The strategy is based on the classic breakout of Bollinger bands with relative pullback.
To recognize a real bounce from a false one that would lead to a continuation of the previous trend, we use the Tradingview indicatorThe Ultimate Buy and Sale Indicator, similar to Bollinger Bands, but with colors that reflect the indication of different indicators, as well as a Buy/Sell arrow.

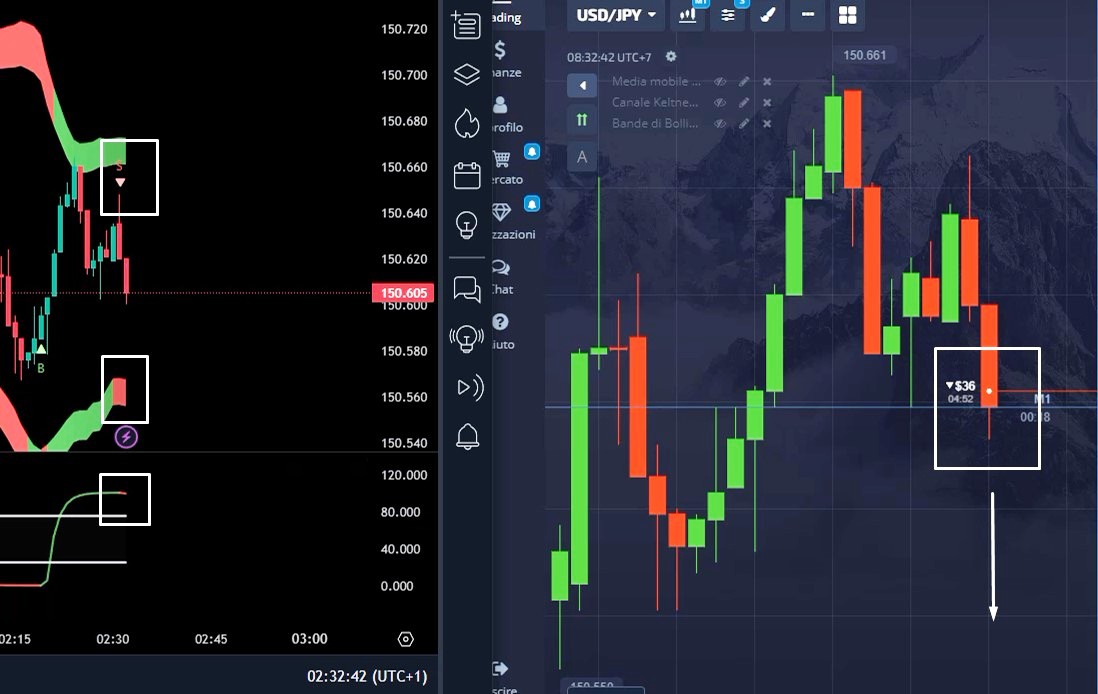
Example. In the figure, the bands are red, and you have to wait for at least one to turn green and for the signal arrow to appear.
In the next sequence we have a warning signal with an arrow, one of the bands is green, but we must also have confirmation of the second STC indicator

The central curve is the 20-period moving average of the Bollinger Bands.
It sometimes behaves like a support/resistance level.
We install the STC indicator with the following parameters:


Input signal.
The Buy/Sell arrows indicate the opening of a position, but this must be confirmed by at least one color on the bands and by the STC indicator.


Tradingview chart on the left, on the right Pocket Option (or your favorite) to open trades. Here are other examples:
PUT
CALL ok, PUT no.

Call, ok

Above PUT ok, Call no.

From left to right, 1. PUT ok, 2. Call no, 3. Call ok.
Trading video examples are on YouTube
Observations and advice
- Do not open positions when the bands are tight.

- The strategy is valid for any time frame. It works well respecting the proportions, for example even with 5 minute candles and 20/30 minute expiry, but more patience is needed to wait for the signals.
- Avoid low volatility markets (small candles that barely move).Trade when the market is lively.
- We do not operate during lateral market phases.
- If you miss a couple of consecutive trades, stop and analyze, something is wrong with your operations.
- Start with the demo, then with a minimum amount, just to test the market and see if everything is calm. Raise the stakes gradually.
- Do not invest more than 5% of your capital in a single trade. 1% or 2% is a reasonable choice.
Conclusion
We hope you have found the simple yet effective system to make profits.
Watch and review video examples with tutorials on YouTube to assimilate the rules well.
If you watch the video examples click like on video YouTube, and subscribe for any updates.
Furthermore, your comment in the description of the video is useful.
Thank you and Happy Trading!


