Support and Resistance – A complete guide for your trading

Support and Resistance: let’s make use of them!

horizontal levels of support and resistance

Many already know what support and resistance levels are, but often used simply as reversal zones they lead to disappointing results. We must be clear if and when they can be used to open a position.

So let’s read the following topics to use the SR levels for our openings the supports and resistances:

  • What are support and resistance (SR)
  • When support or resistance forms
  • How to determine support and resistance levels
  • What to do after plotting SR levels
  • Trend lines for entry confirmations
  • Moving average as support or resistance
  • Fibonacci retracement as support and resistance
  • Ichimoku Cloud to identify reversals

What are support and resistance?

Support and resistance are key levels on a price chart where buying and selling pressure are in balance, causing the price to bounce off or above the level . These are horizontal price levels commonly established by linking the highs of the price bars to other highs or lows to lows. 

Support and resistance levels are important technical tools used in trading to identify possible points where the market could reverse its direction.

Below are a few ways you can use them to make trading decisions.

1. Identify support and resistance levels . The first step is to identify support and resistance levels on the price chart. Support levels are the points where the price has found support in the past and found it difficult to fall further. Conversely, resistance levels are the points where the price has found it difficult to move higher and has found resistance in the past .

2. Use support and resistance levels to make trading decisions . When the price approaches a support level, one can consider buying, as the idea is that the price will find support and start moving up. Conversely, when the price approaches a resistance level, one can consider selling, as the idea is that the price will find resistance and start falling.

3. Confirm support and resistance levels with other technical tools . You can confirm support and resistance levels with other technical tools, such as Fibonacci levels, moving averages or pivot points. This can increase the probability that the support or resistance level will behave as expected.

4. In forex. Use support and resistance levels as stop loss points . The support and resistance levels can also be used as stop loss points to limit losses in case the price moves against the open position.

In general, support and resistance levels are a useful tool for identifying possible market turning points . However, it is important to keep in mind that support and resistance levels are not accurate indicators and the price may cross or break support and resistance levels unpredictably. 

Support and resistance levels are critical technical indicators that form the basis of a wide range of technical analysis tools. Traders determine support and resistance in price action to   identify ideal price points to buy and sell assets  .

Support and resistance are the most essential trading indicators , helping you to eliminate most of the guesswork and identify potential trading opportunities. 

When support or resistance forms

A support or resistance level is formed   when the market’s price action reverses and changes direction, resulting in the formation of a peak or trough (swing point)  . 

Support   is a level on the trading chart beyond which an asset’s price will not fall or fall and bounce. It acts as   a floor which limits any further downward movement  . At this point, buyers are more likely to buy an asset and sellers are reluctant to sell, leading to increased   demand and consequently an increase in the asset’s price  .

Conversely,   resistance   is a level where the price struggles to break through to the upside and is pushed back down again. Resistance is a price point where the asset has   high supply and lower demand, lowering the asset’s price   and preventing further price increases. It acts as a ceiling, limiting further upward movement in prices.

How to determine support and resistance levels

To take out some of the uncertainty that comes with trading, traders should always   consider an asset’s support and resistance levels before entering a trade  . 

Trends and Trend Lines

A trader must first identify key support and resistance levels with the use of several technical indicators. The most common way to identify support and resistance is through   price action, looking for highs and lows over specific periods  . These levels could be recent swing highs or lows or significant price points such as round numbers or psychological levels. Traders use the line graph tool to connect the highs and lows and draw lines accordingly.

Support and resistance lines (blue) identified based on recent price action

Trendlines are another graphical tool that can be used. These   lines connect two or more price points on a chart  , making it fairly easy to use. In an uptrend, the trendline acts as a support level, while in a downtrend, the trendline acts as a resistance level.

Use moving averages

Another way is to use the   10-day, 20-day, 50-day, 100-day or 200-day moving averages to identify support and resistance levels  . The moving average can act as a support level when the price is above it; conversely, the moving average can act as a resistance level when the price is below it. 

The 20-day moving average indicator (red line) used as a support and resistance level

Fibonacci retracement as support and resistance

Fibonacci retracement is another technical analysis tool used to identify potential support and resistance levels. It is based on the Fibonacci sequence, introduced by the Italian mathematician Leonardo Fibonacci. The Fibonacci sequence is a series of numbers where each number is the sum of the previous two numbers, starting with 0 and 1. These levels are drawn using horizontal lines to mark the percentage retracement levels between the highest and lowest points of a market. 

Fibonacci retracement levels are used to determine potential support or resistance levels  . This can help   identify key areas where traders could enter or exit positions, as well as potential stop loss levels   to manage risk.

Fibonacci retracements applied to the price chart

Ichimoku Cloud

The Ichimoku Cloud, also known as Ichimoku Kinko Hyo, is a technical analysis tool used to   reveal overall trend strength and direction  . Ichimoku helps   identify potential trend reversals and momentum shifts   in the market. 

The Ichimoku Cloud indicator is composed of several elements, including the   Conversion Line (Tenkan-sen)   (9 periods)   and   the Standard Line (Kijun-sen)   (26 periods)   which act as dynamic support and resistance lines. While this indicator may seem a bit complicated, it’s not difficult to understand and can prove to be extremely useful. 

Ichimoku Cloud used to determine support and resistance levels

Traders often use Ichimoku support and resistance levels in conjunction with other technical indicators such as Relative Strength Index (RSI), Moving Average Convergence Divergence (MACD), and Bollinger Bands to further confirm received signals and improve the accuracy of their trades.

How to open a trade

Once the support and resistance levels are confirmed, traders need to   analyze the price action   around these levels.

If the price breaks above resistance or falls below support, it could indicate a potential trend reversal or continuation.

Support

  • To enter a long position (“Buy”), a trader can open a trade just above the support level after a bounce  . In forex to minimize potential losses in the event of a downtrend reversal, a trader can   set a stop-loss order just below the support level   when placing a buy order.

Resistence

  • In short selling (“Sell”), a trader needs   to pay attention to the resistance level  . Short positions can be entered just below resistance levels, with the expectation of a price decline. The stop loss can be set just above the resistance level.

Support and resistance on Pocket Option and Quotex

Pocket Option and Quotex are online trading platforms that offer multiple financial instruments, including forex, stocks, commodities and cryptocurrencies. ea platforms provide a rich set of technical analysis tools, such as the ones mentioned above. Alternatively you can use Metatrader as a graphical reference.

These brokers with their charting tools help identify SR levels where the market is likely to experience buying or selling pressure. It works by drawing horizontal lines on the price chart, indicating levels where the market has previously encountered support or resistance.

The trader can manually plot his own support and resistance levels with these tools to monitor how the market reacts as prices approach those levels.

Charting tools, available on the Pocket Option platform

Do you want to learn more about the topic? Here is the Support and Resistance Strategy with a free indicator:

Conclusion

Support and resistance levels are important tools for identifying potential trading opportunities and managing risk. Understanding and applying support and resistance levels can significantly improve a trader’s chances of success.

Don’t hesitate to practice using these indicators in your demo account to maximize your profits.

_____________________________

Questions about trading? Try AI, Artificial Intelligence
(Robot bottom right)

Below you can see the brokers most used by our traders.  they have been selected based on the number of registrations and trading operations. In addition to these, you can view the complete list of brokers with relative comparison.

Go to the list

Visit our Italian website ForzaForex.it (translator option in many languages) full of free indicators, strategies and unique resources!

By registering through these links you get preferential assistance, various free resources and the possibility of free access to the VIP signal room. Clear cookies before visiting a broker. Send your ID, teh identification number that the broker assigns you, to info@freebinaryoptions.one.

Risk warning: "Binary options are not promoted or sold to retail EEA traders" If  the broker is not authorized in your area, e.g. IQ Option  (Eurozone / Usa), you can choose from our Broker Comparison (reliable brokers who accept traders from all over the world, following image):


NON Repaint Alert Arrows indicator

NON Repaint Alert Arrows indicator

For autotrading systems like MT2 or manuals referring to Metatrader.

The non-repaint indicator that we offer was created by forzaforex.it for the need for automatic trading with arrows, but it can also be installed on Metatrader 4 for manual use.

It is called the “ Alert Arrows Non Repaint ” Indicator. Being equipped with arrow alerts it is possible to test it in automatic programs such as MT2 . It is one of the best indicators tested and currently in use on our MT2.

A NON REPAINT indicator for free download

A NON REPAINT indicator, which does not change its past appearance, free to download.

A “non-repaint” indicator is what more experienced traders are looking for. Unfortunately the indicators are almost all “repaint” and most aspiring traders do not know what the term means. And when they find out, the damage is often already done!

The term “repaint” refers to the characteristics of the indicator, which changes its past appearance by “adapting” to changes in the graph, thus giving information on its performance that is no longer verifiable. In practice, a new “coat of paint” is given to appear more valid.

The trader thus finds himself in the position of not being able to evaluate the quality of his indicator by observing the graphs of the past.

The indicator works! But unfortunately it is a “repaint”.

How many times have you been thrilled to discover the validity of your indicator’s performance in the charts past?

Proposing to traders this type of indicators from sites that sell indicators and strategies by making money on them is not difficult, as these indicators will only ever show you their best entries that have occurred in the past. These are the indicators called precisely with the English term of “repaint”

But will these instruments still give you perfect input signals in the future? The answer is no. There is no indicator that gives you perfect input signals every time.

Not even the “not repaint” indicator, but at least it gives you the ability to see how it has performed in the past and evaluate its effectiveness or not. In this way you will be able to “take note” of any past errors.

Example of a classic “repaint” indicator

ZIG ZAG repaint indicator

ZIG ZAG repaint indicator

Most of the indicators that you will find on the net, free or paid, are repaint.

An example can be the Zig Zag indicator that you also find by default on metatrader.

Zig Zag follows the development of prices and connects highs and lows, giving an overview of market fluctuations.

It would seem a useful indicator at first glance, unfortunately it self-regulates (it “repaints” in practice) depending on where the new candles form, not allowing the reversal point to be established.

However, it is useful to have an overview of the overall market trend.

Non Repaint indicator for metatrader 4. Entry Signal.

Non Repaint indicator for metatrader 4. Put Entry Signal (red arrow). Entry at the opening of the green candle.


How to use the non repaint indicator

The “Alert Non Repaint” indicator does not repaint, but it is possible that after its appearance, during the formation of the candle it may disappear and reappear .

In any case, by not doing the repaint, the indicator does not change its appearance after the candle closes , so it is best to wait for the next candle to open before considering entering the trade.

Types of Assets

The indicator can be used on major currency pairs and gives a good percentage of profit signals.

Time Frame

Even the time frames can be chosen. In any case, those from M15 and up are recommended.

Entrance

After the opening of the next candle

Alert

If you are not using the MT2 Autotrading robot it can be tedious to wait for the entry signal arrow to appear. In this case it is useful to leave the buzzer on.

Indicator installation

If you don’t remember them follow the procedure on How to install an indicator on MT4

Indicator characteristics

  • Platform: Metatrader4
  • Asset: Every major currency pair.
  • Trading Hours: 24 hours in open markets.
  • Timeframe: M30 or H1
  • Expiry: about 4 to 6 candles (120/180 minutes on M30)
Arrow sign indicator Alert Arrows

Arrow sign indicator Alert Arrows

The indicator is complete with template and PDF instructions.

The file you receive contains:

  • The Alert Non Repaint indicator for Metatrader 4
  • Template Alert Non Repaint.tpl for MT4 screen ready.
  • PDF Indicator Alert Arrows Non Repaint

Buy the indicator

The indicator costs €69. Buy and download it now:

(Click the logo or scan the code)

Buy Now and Download

Payment Protected by  Stripe Chargeback


This image has an empty alt attribute;  its file name is Paypal.svg_.png

If you only have PayPal, request payment to info@forzaforex.com

_____________________________

Questions about trading? Try AI, Artificial Intelligence
(Robot bottom right)

Below you can see the brokers most used by our traders.  they have been selected based on the number of registrations and trading operations. In addition to these, you can view the complete list of brokers with relative comparison.

Go to the list

Visit our Italian website ForzaForex.it (translator option in many languages) full of free indicators, strategies and unique resources!

By registering through these links you get preferential assistance, various free resources and the possibility of free access to the VIP signal room. Clear cookies before visiting a broker. Send your ID, teh identification number that the broker assigns you, to info@freebinaryoptions.one.

Risk warning: "Binary options are not promoted or sold to retail EEA traders" If  the broker is not authorized in your area, e.g. IQ Option  (Eurozone / Usa), you can choose from our Broker Comparison (reliable brokers who accept traders from all over the world, following image):


Martingale MT2 Trading

Martingale

What is the Martingale strategy?

The idea of ​​the Martingale strategy is to counteract the losses caused by lost trades. In standard Martingale, if you lose a trade, you re-enter with a greater trade amount, so that over time, a winning trade will compensate all the previous losses. This new trade amount is equivalent to the amount of the lost trade multiplied by a Martingale coefficient. It should be noted that Martingale strategy can be risky, so you will have to be very careful when setting it up.

Configuration from the MetaTrader Auto Connector and Manual Connector

The Martingale section is composed of three parameters By default, the martingale strategy is turned off.

A. Martingale

It’s time to choose which type of Martingale you are going to use. If you open the menu where by default “No Martingale” is selected, you’ll get seven different Martingale options to choose.
First of all, you must distinguish two different strategy types: Martingale and Anti-Martingale.

  • MartingaleThis is the standard Martingale strategy. It applies to lost trades. Once you lose an operation, a new trade will be opened with a greater trade amount (equivalent to the lost trade amount multiplied by a martingale coefficient)

  • Anti-Martingale: Unlike the standard Martingale, the strategy applies to the won trades. If you win an operation, a new trade will be opened with a greater trade amount.

NOTE: It is suggested that for Anti-Martingale, the coefficient is less than one. Otherwise, you would lose what you’ve gained.

Once you have decided the Martingale strategy to use, it’s time to decide when to apply it.
There are two possible options:

  • “On next expiry”: Martingale will be applied immediately after the current trade closes on the same currency pair.
  • “On next signal”: Martingale will be applied on the next signal. You can either choose to apply it on the same currency pair or any.

If you choose to execute Martingale “On next signal”, you will find that there are two possible options:

  • “On next signal (Connector)”: Martingale will only be applied on the next signal of the same currency pair.

For example: If you lose a USDCHF trade and our Martingale is configured on ‘Connector’, it will be applied only when a USDCHF signal comes.

  • “On next signal (Terminal)”: If you choose this option, Martingale will be applied on the next signal of any of the pairs configured on ‘Terminal’.

For example: Suppose you’ve configured USDCHF, EURUSD & AUDUSD pairs on ‘Terminal’, and lose a trade in one of these pairs. Martingale will be applied on the next received signal from any of the pairs configured on ‘Terminal’ (in this example USDCHF, EURUSD & AUDUSD). If you lose a EURUSD trade, the Martingale step can be executed only in USDCHF, EURUSD or AUDUSD.

B. Martingale steps

This parameter defines the number of Martingale steps. If you lose a trade, the first Martingale step will be applied. It will multiply the previous trade amount by the chosen coefficient. In case you lose the first Martingale step, the second step will be applied. If you keep losing, it will keep applying the Martingale strategy until reaching the maximum number of steps you’ve set. If the last step is reached and the trade is lost, the Martingale step counter will reset to zero.
You can use as many steps as you wish, but remember that the greater the number of steps, the greater the risk.

C. Martingale coefficient

This is the number that will multiply your trade amount on each Martingale step. For each new Martingale step executed, a new trade amount will be calculated (previous step trade amount multiplied by the chosen coefficient)
In the example above, if the trade with an amount of $2 USD results in loss and your Martingale coefficient is 2, it will multiply $2 USD x 2 and the next step of Martingale will be $4 USD.

Override signal provider’s Martingale Strategy

What can I do if my Copytrading provider’s Martingale strategy does not convince me? Just override your providers settings and configure your own

This window will be automatically opened when you send a subscription request to a signal provider.
Once in this window, just follow these steps:

  1. Check “Override provider’s Martingale settings”.
  2. Define and set the number of Martingale steps.
  3. Set the Martingale coefficient.

In case you want to deactivate the provider’s Martingale, check the “No Martingale” option.

Fixed Martingale for MetaTrader signals

From the “Configuration” section of MT2 you’ll be able to customize the amount of each Martingale step, without having to use always the same coefficient.

Inside the ‘Configuration’ section we are allowed to set different Martingale coefficients for each step.
Check the ‘Amount’ parameter, where we will adjust the trade amount without Martingale.
The ‘Fixed Martingale’ option will be automatically activated. Set the fixed amount of each of the 7 steps of Martingale to personal need.

_____________________________

Questions about trading? Try AI, Artificial Intelligence
(Robot bottom right)

Below you can see the brokers most used by our traders.  they have been selected based on the number of registrations and trading operations. In addition to these, you can view the complete list of brokers with relative comparison.

Go to the list

Visit our Italian website ForzaForex.it (translator option in many languages) full of free indicators, strategies and unique resources!

By registering through these links you get preferential assistance, various free resources and the possibility of free access to the VIP signal room. Clear cookies before visiting a broker. Send your ID, teh identification number that the broker assigns you, to info@freebinaryoptions.one.

Risk warning: "Binary options are not promoted or sold to retail EEA traders" If  the broker is not authorized in your area, e.g. IQ Option  (Eurozone / Usa), you can choose from our Broker Comparison (reliable brokers who accept traders from all over the world, following image):


Automated Binary Options Trading

MT2 Trading landing page

Automated Binary Options Trading. Not just a robot

You can:

  • Automate your MetaTrader 4/5 arrow indicator signals
  • Trade manually on your MetaTrader 4/5 live market charts
  • CopyTrading: Trade like the experts without being one

Let’s start with the most important one, the one for automated trading.

MT2 Automated Binary Options Trading

Trade Binary Options based on your MetaTrader Indicators

Supported Brokers: IQOption | Alpari | Spectre.ai | GCOption …and more

Try for free

Prepare everything you need

  1. Register with a broker, whose login data should be entered later in the MT2 login screen
  2. Diwnload ed install Metatrader. The broker will send you via email the data to activate the connection with Metatrader (they are different from the broker login data).
  3.  Folder with the indicators provided by MT2 Trading web site

Note: In the compressed folder of the free MT2 download you will also find the Alpari Metatrader 4 or 5 installation file, which we recommend as it is immediate and easy to install. (suggested MT4 because there is more choice of indicators)

MT4 di Alpari FixContracts

Note: In the compressed folder of the free download you will also find the Alpari Metatrader installation file, which we recommend as it is immediate and easy to install

Alpari  and GCOption (Grand Capital) have the Metatrader for download on their site.Recommended Metatrader4 because it accepts more choice of indicators.


Automate your trading

Set up a trading robot to auto-trade for you 


1. Automate your MetaTrader 4/5 arrow indicator signals

Connecting your MetaTrader 4/5 technical indicators with your favorite broker in order to automate technical indicators signals or to trade manually directly on graphics.

Try for free

Download and connect MT4

open the windows you want

Auto-signals Connector

What is the Auto-signals Connector?

The auto-signals connector acts as a bridge between MetaTrader 4/5 and MT2 Trading Platform.
It will send your MetaTrader indicator/s signals to the trading robot, which will automatically open the trades in your broker/s account/s.

There are currently two versions of the signal connector.
In our update 12.3 we launched our new connector, with an improved interface and simpler configuration. Due to the requests of some users, the old version is also available for everyone to use. In this documentation we will explain in full detail how to configure and use both connectors.

How to load it on Metatrader?

To successfully load the MT2 Trading files on MetaTrader, you must copy and paste or drag both the indicators and the libraries that include the MT2Trading folder.

  1. Locate the connector file ‘MTTrading_Auto.ex4 /ex5’ inside MT2Trading downloaded folder: ‘MT2Trading > MetaTrader > MT4/MT5 > MQL4/MQL5 > Indicators’.
  2. Copy the connector file ‘MT2Trading_Auto.ex4 /ex5’.
  3. Paste the file into MetaTrader folders. To do this go to: ‘File > Open Data Folder > MQL4/MQL5 > Indicators’. 


Secondly, you must do the same with the Libraries files.

  1. Localize the library file “mt2trading_library.ex4/ex5” inside the folder: “MT2Trading -MetaTrader > MT4/MT5 > MQL4 / MQL5 > Libraries”.
  2. Copy the library file“mt2trading_library.ex4/ex5″”.
  3. Paste on MetaTrader, to do so go to: “File > Open Data Folder > MQL4 / MQL5 > Libraries”.

How to open it on MetaTrader?

Once you have the connector file inside your MetaTrader folders, proceed to open it on a chart.

  1. Open a new chart and choose your desired timeframe.
  2. Open the browser: Pressing CTRL + N.
  3. Drag your signals indicator/template to the chart (in case you don’t have an indicator, we include inside the MT2 download files the “BinaryProfit” indicator as a courtesy.”
  4. Drag the connector file “MT2Trading_Auto” to the chart.

Drag the indicators
Once you have dragged your indicator and connector into the graph successfully, you’ll find the connector configuration window, which looks like this:

Customizable parameters

1. Indicator name

The name of the indicator is used to identify where the signals that will be placed in your account come from and to show their names on the trades table on MT2 Trading platform. The statistics and the historical data are also based and ordered according to the names of the signals you trade with.
Once you drag the connector to your chart with an indicator, you just have to click on the little arrow on the side and all the indicators on your charts will appear there.

Choose your indicator
In this case we will use the indicator “BinaryProfit” as an example. Remember that you can use any indicator you want (only one)
As you can see, the signals will be displayed on the trades table with the same name as your MetaTrader indicator.
2. Up # (signal buffer)

Every MetaTrader indicator that generates signals in the form of arrows, points or other graphic signs, transmits the signal data in the so-called indicator buffers.

Once the connector identifies the signal indicator, it will automatically read the arrows or points of it and give you the option of configuring the buffers for the robot to place CALL or PUT trades for you.

In the “Up” buffer you must select which graphic resource is the one that will indicate to the robot to open a CALL trade in your account.

In this example, you can see how we selected the green arrow upwards for the robot to identify as CALL operations.
3. Down # (signal buffer)

Contraty to the UP buffer, the “Down” buffer will be responsible for identifying the signal from your indicator on your graph and open PUT trades for you in your account.

In this example, you can see how we selected the red arrow down for the robot to identify as PUT operations.
4. Entry Type

Once you have configured the signal buffers, you can choose between two types of entries: OnNewBar or Intrabar.

  • On the new bar entry, the trade will be carried out at the end of the candle in which the robot received the signal (that is, at the opening of the new bar).
  • On the intrabar entry, the trade must be opened immediately when the signal appears.

Most reverse indicators generate signals to enter on the new bar, while trend indicators commonly generate signals for the intrabar entry.

5. Trading Amount

This parameter allows you to set the amount of money invested on each trade.
In the example, we can see that the amount is “1.0” which means that each trade that the robot opens will be of $1 USD.

If you wanted to change the amount of each operation, you should just modify this parameter.

For example: For $5 USD, you should write “5.0”. For $ 10 USD you should write “10.0”, and so on…

6. Expiry Time

This parameter will alow you to set the temporality of your trades.
In the example, the expiration is set to “5”.

This means that every operation the robot opens will automatically close 5 minutes after.
If you would like major or minor temporalities, just modify this number.

7. Martingale

By default the Martingale strategy is disabled.
To activate it open the menu where it says “No Martingale” and choose your preferred option.

If you would like to learn all about Martingale Strategy, click here

8. Broker

Finally, you must decide in which broker/s you want your trading robot to be placing trades for you.
By default, “All” is selected, meaning all the trades will be placed in all the brokers (as long as it has accounts of those brokers opened in MT2 Trading).

To modify this parameter and choose your broker you should follow the next steps:

  1. Within MetaTrader, go to the top-right menu and click “Charts > Indicators List > MT2trading_auto”> Edit”.
  2. Click on “Inputs > Select broker > click on the small arrow facing down on the right”
  3. Select your preferred brokers and click “OK”

Select your preferred broker
If you’ve connected your indicator correctly, you should see a window like this on your charts

or if you use a custom indicator (this is ours, Superclassic Arrows)

To temporarily stop the connector, you just can click on the “Pause” button and your robot will stop trading.
To have it up and trading again, you just need to click on the “Start” button again and your robot will continue trading.


2.  Trade manually on your MetaTrader 4/5 live market charts

Place trades manually on your MetaTrader 4/5 trading charts by clicking on ‘Call’ and ‘Put’ buttons.

Create a bridge between your favorite broker and your MetaTrader 4/5 platform in order to automate technical indicators signals or to trade manually directly on graphics.

Try for free

3. CopyTrading: Trade like the experts without being one

Choose within top-performing Binary Options expert traders and copy their trading signals on real time.

Try for free


_____________________________

Questions about trading? Try AI, Artificial Intelligence
(Robot bottom right)

Below you can see the brokers most used by our traders.  they have been selected based on the number of registrations and trading operations. In addition to these, you can view the complete list of brokers with relative comparison.

Go to the list

Visit our Italian website ForzaForex.it (translator option in many languages) full of free indicators, strategies and unique resources!

By registering through these links you get preferential assistance, various free resources and the possibility of free access to the VIP signal room. Clear cookies before visiting a broker. Send your ID, teh identification number that the broker assigns you, to info@freebinaryoptions.one.

Risk warning: "Binary options are not promoted or sold to retail EEA traders" If  the broker is not authorized in your area, e.g. IQ Option  (Eurozone / Usa), you can choose from our Broker Comparison (reliable brokers who accept traders from all over the world, following image):


Fisherman’s Strategy

FreeBinaryOptions.one presents:

The Fisherman’s Strategy

The free trading system suitable for everyone

Note: We remind you that the PDF attached to the strategy is available at the end of the page and can be downloaded free of charge. The already set indicators are logically attached in the full version. 

Attention: If you already use one of our brokers for real, contact us by providing your ID to immediately obtain the complete download (info@forzaforex.it).

Introduction

We have been asked many times what kind of strategy would be suitable for those who are new to trading .

We have therefore developed a trading system that is simply based on only two indicators, but highly effective, chosen and tested for a long time. The trader just has to follow the instructions in this manual and open the position after the conditions are met.

This strategy was created thinking of those who do not yet have sufficient knowledge of technical analysis, but nevertheless want to try their hand at binary options, perhaps starting from a simple demo, to see “what happens”.

As always, we recommend that you delve into the main topics that the trader should know, such as money management, trendlines, supports and resistances, etc. However, to get started, it is sufficient to have a minimum of familiarity with the free Metatrader (MT4) platform to use as a reference, where two simple indicators and the template will be installed, i.e. the 3 files attached to the system (in the full download version ) .

Note: We remind you that the PDF attached to the strategy is already available and can be downloaded free of charge, always at the end of the page. The indicators are logically attached in the full version, but it is possible to look for alternatives on the net.

The strategy provides for short deadlines , of around 20-30 minutes, in any case the one closest to these values ​​that the broker makes available to us.
The system is valid for any currency pair and at any time ( pay attention to the news ).

Prepare the graph

First you need to have the Metatrader 4 platform available; if you don’t have it, you can find the free download link here (the link takes you to the Alpari broker, which in addition to the metatrader to download for free also allows binary options trading directly from the chart).

Once MT4 is activated, you need to install the two indicators and the template; if you don’t remember how to do it read here. The chart will look something like this (here we are on GBP/USD M1):

The areas in blue are those of the “Fishing Area” and below the “Fisherman_by_FF” indicator.

Entry signal

We need to choose a currency pair that is close to the blue zone. To this end, we prepare the chart on the M1 time frame, to better observe the movement of the candles. However, it will be M5 that will give us the actual entry signal .

In the image above you can see that the GBP/USD is approaching the lower zone.
The input signal will be obtained when the following three conditions occur simultaneously:

1. The M1 candle closes inside the blue “Fisher Area”, or goes beyond it.
2. The color of the Fisherman indicator on M5 changes color. Example, still in the image above, red to green
3. The color of the Fisherman indicator on M1 has the same color as M5. Example, in the case of the image above, from red to green.

Fisher Area Indicator

It is the indicator that shows the blue zones. The operation of the indicator is simple.

To have an entry signal, the candle must be closed inside the blue area, or above, having therefore exceeded it.
Since these are reversal zones , the upper area will give a Put entry signal, the lower one a Call entry.

Note that the areas change every hour, and therefore it is advisable to manually reset the graph when the hour expires. It is sufficient to switch for example from M1 to M5, or vice versa.

Practical examples of trading

Example 1

We are on M5, around 11:30 and the candles are in the blue area, so we await the signal of the lower colored indicator.

We know that the blue areas change every hour, so the next 12:00.

If the signal arrives after 12:00 we will consider it valid even if the blue zones have changed.

Put, if M1 is also red

After 12:00 the zones modified themselves, the candles are now no longer in the blue area, but we will not take this into account, as the zone has previously given us confirmation of possible entry.

When the color of the lower fisherman indicator on M5 changes, we open the PUT operation, as shown in the figure, provided that the color is still red on M1 as well.

The entry, which took place at about 12:10, concluded ITM (in the money), as can be seen from the trend of the graph in this image above.

Example 2.

Verified that both M5 and M1 both have the red color (otherwise green, lower area) of the Fisherman indicator, you enter at the close of the M5 candle:

In practice, the appearance of a first colored segment on M5 is not enough, but it is necessary to wait for the appearance of a second one.

Example 3.

In the figure we see that the candles on M5 have reached the upper blue area, but the lower indicator has not yet given the confirmation with the color change. Let’s wait.

Over time, a first red segment appears (figure below). That’s not enough, we have to wait for a later one:

Just one segment. Wait for the second

Finally the input signal arrives:

M5 OK. Check M1
M5 OK. Check M1

However, we must make sure that on M1 the color is also red:

The color corresponds to M5. PUT entry
The color corresponds to M5. PUT Entry

The color matches, and therefore we proceed with the purchase of the Put option, with an expiry of about 25 minutes (in this practical example.
The operation ends ITM, as seen in the following image:


Important notes.

These tips are based on our trading experience with the fisherman system, which we use frequently and test in practice.

1. The color change usually happens first on m1, but we need to follow up when the change happens on m5.

Always make sure, for input signal confirmation on M5, that the indicator on M1 is still the same color , thus confirming the correctness of the indicator signal.
Otherwise, wait for correspondence.

2. We must wait for the closing of the M5 candle corresponding to the color change. Otherwise the candle, being still forming, could change the color of the indicator again.

In practice we wait for the appearance of a second colored segment on M5.

Indicators setting

If you have installed the attached template, you don’t need to make any settings and you can skip this paragraph. In case it helps you, the adjustments we apply for the FisherArea indicator can be found in the PDF version

Download the complete PDF for free (email):

Fisherman's strategy PDF with settings

PDF STRATEGY FISHERMAN DOWNLOAD

If you want to buy the Full System Fisherman’s Strategy:

System Content

1. PDF Trading Manual
2. TheFisherman_by_FF.ex4 indicator
3. FishingArea.ex4 indicator
4. TheFisherman.tpl template


Buy now $42  

(Click the logo or scan the code)

Buy now and download immediately


This image has an empty alt attribute; its file name is Paypal.svg_.png

If you only have PayPal, request payment to info@freebinaryoptions.one

_____________________________

Questions about trading? Try AI, Artificial Intelligence
(Robot bottom right)

Below you can see the brokers most used by our traders.  they have been selected based on the number of registrations and trading operations. In addition to these, you can view the complete list of brokers with relative comparison.

Go to the list

Visit our Italian website ForzaForex.it (translator option in many languages) full of free indicators, strategies and unique resources!

By registering through these links you get preferential assistance, various free resources and the possibility of free access to the VIP signal room. Clear cookies before visiting a broker. Send your ID, teh identification number that the broker assigns you, to info@freebinaryoptions.one.

Risk warning: "Binary options are not promoted or sold to retail EEA traders" If  the broker is not authorized in your area, e.g. IQ Option  (Eurozone / Usa), you can choose from our Broker Comparison (reliable brokers who accept traders from all over the world, following image):


Bollinger Bands + RSI

Bollinger Bands + RSI Strategy

RISK WARNING: Your capital may be at risk

The Bollinger Bands RSI trading pattern is perhaps the most respected trading system .
In this system , ForzaForex.it illustrates complete trading rules which are added to those commonly found in normal tutorials and which give a greater guarantee of success.

 Bollinger Bands RSI involves the combined use of two well-known indicators:

  • BOLLINGER BANDS
  • RSI INDICATOR (Relative Strength Index)

This is one of the most effective classic techniques , and experienced traders agree. So, is the problem of winning with binary trading now solved?
No. It would be too nice and simple if that were the case.

We also need a cold behavior typical of the seasoned trader who patiently waits for the right signal for entry, without haste.
Furthermore, a possible loss does not distract him from his goal: to follow the rules.

This classic technique is suitable for use with any binary options broker, perhaps coupled with Metatrader. 

Read also:

https://www.theguitarband.com/what-are-bollinger-bands/

Taking advantage of the reversal (or rebound)

Before talking about the real rules of the strategy with Bollinger bands and RSI, it is useful to refresh the functioning of the two indicators involved, in order to master the mechanism of the system that we are going to use.

We also recall that the Bollinger bands pair well with an “oscillator” indicator, such as the stochastic . In any case, coupling with the RSI oscillator remains one of the most classic.

The Bollinger Bands RSI strategy, as the name implies, uses both the  Bollinger Bands and the RSI indicator to take advantage of the momentary changes in direction  (“bounce” or “bounce”) that occur during the main trend, as illustrated in figure:

Strategy Bollinger Bands - RSI: Current trend change

Strategy Bollinger Bands RSI: Current trend change

Entry will take place in “Call” at the second reversal, in the direction of the main trend, as we will see later.

The Bollinger Bands RSI pattern indicators

Used indicators:

  1. Bollinger Bands indicator (20, 2)
  2.  RSI indicator (Relative Strength Index) (14)

At a first observation it would seem valid to buy when the price touches the lower band and to sell when it touches the upper band . Technically this works, but it is a risky way to trade Bollinger Bands.

Prices touch the Bollinger Bands

Sometimes strong trends cross these bands and lead the unfortunate trader to losses.
That’s why we will go alongside the RSI indicator as confirmation for the price reversal at the upper or lower band.

These two indicators, Bollinger and RSI, being widely used by traders, are usually part of the standard equipment of most graphic platforms, such as the Metatrader for example, and in this strategy it is not necessary to change the default settings.

As an alternative to observing the chart on Metatrader, it is convenient to use these indicators directly in the trading platform. They have, in addition to other indicators available as standard , both the Bollinger Bands and the RSI .

Rules of the Bollinger Bands RSI

Rule #1: Identify the current trend.

A lateral market situation is not valid , i.e. without an apparent trend, generally with horizontal price distribution. Otherwise this strategy will not work as well.

How to spot the trend

There are many methods to identify a trend, such as the use of trendlines, lines that combine maximums with maximums of price fluctuations between them and minimums with minimums.
If you want to know the trend directly, without the need for our analysis, you can use the   “Technical Investing Summary” , which for example for EUR/USD gives us information like:

Investing : Current trend table

The following description concerns a case of a positive trend. The opposite case is analogous.

As an example, suppose we have therefore identified a positive trend, rising prices (uptrend):

Rule No. 2: The asset, which was in an “uptrend” phase, changes direction and heads down towards the lower band until it touches it.

Prices head towards the lower band, until they touch it, or almost.

To clarify better, let’s see that prices have a general positive trend, but in the short term the momentary trend changes after generally touching the upper band, bringing the candles down to the lower band.

The price is rejected and touches the lower band

Rule n°3: Once the candlestick touches the lower band we look at the RSI.

It should be between 30% and 50%  and  UPLOAD , i.e. same direction as the general trend.

The trend of the RSI is up and is between 30% and 50%. Its direction is the same as the general trend

RSI regulation note

– If the RSI indicator does not have the 50% level, simply add it using the settings.– By default it does not have the central line 50% but this can be solved as follows:

Metatrader case– In Metatrader you can add the 50% level in the indicator settings.

IQ Option Case– IQ Option’s RSI has only two levels. To remedy this, two identical indicators can be activated by changing the settings, one with 30 and 50, the other with 50 and 70:

RSI indicator on IQ Option


RSI ranges

In the case we were observing before of a general positive trend, if the RSI is not in this range 30 – 50, and for example it is over 50, we will not enter the trade.

RSI on the rise

Otherwise, buy in “put”, RSI should be between 50 and 70 and have a decreasing direction.

Let’s zoom in to see the RSI line in the figure opposite.

Rule n°4: ENTRY MOMENT  at the appearance of a decisive bullish candle.

Once you notice this movement prepare yourself for entry.

The price has touched the lower band and the RSI is rising, you can enter after seeing a strong bullish green candlestick:

Entry after a strong bullish green candlestick

Second Entrance. When the price touches the central band you can decide to make a second entry with a good chance of success.

An even more comprehensive strategy makes use of divergences:

Conclusion

The Bollinger Bands – RSI strategy is a classic trading system used by many traders. It is simple and gives good results by combining two of the most popular binary options indicators.

_____________________________

Questions about trading? Try AI, Artificial Intelligence
(Robot bottom right)

Below you can see the brokers most used by our traders.  they have been selected based on the number of registrations and trading operations. In addition to these, you can view the complete list of brokers with relative comparison.

Go to the list

Visit our Italian website ForzaForex.it (translator option in many languages) full of free indicators, strategies and unique resources!

By registering through these links you get preferential assistance, various free resources and the possibility of free access to the VIP signal room. Clear cookies before visiting a broker. Send your ID, teh identification number that the broker assigns you, to info@freebinaryoptions.one.

Risk warning: "Binary options are not promoted or sold to retail EEA traders" If  the broker is not authorized in your area, e.g. IQ Option  (Eurozone / Usa), you can choose from our Broker Comparison (reliable brokers who accept traders from all over the world, following image):


What are Bollinger Bands

The Bollinger Bands. One of the most used binary options trading indicators.

But are Bollinger Bands still useful? How do they adjust? Alone or with other indicators?

We have already recently talked about trading based on a moving average and then on two moving averages.
If we wanted to use 3 moving averages, we could install the  Bollinger Bands indicator , which is based on 3 of these averages.

The purpose of the bands is to give a  relative view of above and below . Thus, in theory, prices are  high in the upper band and low in the lower band.

In this article we see  how to set the parameters  according to our trading needs, and for those who want to go further, a more complete application with matching RSI indicator.

What are Bollinger Bands? If you have never used this indicator in the past, take a look at the graph in the figure to see what the Bollinger Bands look like :

Image of the Bollinger Bands in the IQ Option trading platform . The indicator is present by default on most platforms.

What are Bollinger Bands

Bollinger Bands, also known as “Bollinger Bands” are well known in the trading community.

They are named after their creator, John Bollinger, who made them known in the early eighties. The purpose of these bands was to give a relative definition of upper and lower. Thus, in theory, prices are high in the upper band and low in the lower band.

Bollinger Bands include three different lines , upper, middle, lower . The midline typically serves as the basis for both the upper and lower lines. They are mainly used to determine when prices are overbought and oversold. From this it can be deduced that it is convenient to sell when prices touch the upper band and buy when prices touch the lower one.

Volatility

The space between the bands is determined by “volatility” , i.e. how much the price action varies over time. A high volatility, for example, indicates a high trading volume. Many trading strategies are often more used in the presence of high volatility, as more reliable signals are obtained.

The central or median band consists of a 20-period moving average , while the upper and lower bands have a standard deviation from this, which in practice means that the width of the bands yields a statistical measure of the volatility of the market.

When you see the broad bands it means that we are in the presence of high volatility , narrow bands low volatility .

Video Tutorial Bollinger Bands

In the video a brief but understandable description of the Bollinger Bands:
https://www.youtube.com/embed/CnJYMmU6c7k

Bollinger Bands is an indicator that provides a range of movement in the price of an asset .

It is created, as already mentioned, on the basis of three moving averages , one of them in the center, the other two at an equal distance from it.

Bandwidth

the price touches one of the bollinger bands

The price touches one of the Bollinger Bands

Bandwidth is calculated according to a mathematical standard deviation formula. It is possible to set the coefficient in the indicator settings. The higher this is, the wider the band will be and the price chart will touch the margins more rarely.

the higher the market volatility, the wider the corridor

Wide corridor = higher volatility

Period

Another adjustment concerns the value of the period , i.e. the number of candles used in calculating the value of the indicator. The increase in the period “smooths” the corridor but does not guarantee an increase in the accuracy of the indicator readings.

When the price reaches or touches one of the lines, the probability of its movement shifts in the opposite direction. 

Breaking any of the lines signals a probable trend move through the perforation . The higher the market volatility , the wider the corridor. Prolonged presence of the indicator in a narrow corridor usually precedes the start of a strong movement in the market.

The use of Bollinger Bands in association with other indicators (indicators/oscillators such as Stochastic or RSI) is recommended as it is ineffective during a strong trend.

Trading strategy with Bollinger Bands + RSI

The most classic of binary options strategies which involves the combined use of two well-known indicators:

  • BOLLINGER BANDS
  • RSI INDICATOR (Relative Strength Index)

The Bollinger Bands Strategy with RSI is perhaps the most popular band trading system.

_____________________________

Questions about trading? Try AI, Artificial Intelligence
(Robot bottom right)

Below you can see the brokers most used by our traders.  they have been selected based on the number of registrations and trading operations. In addition to these, you can view the complete list of brokers with relative comparison.

Go to the list

Visit our Italian website ForzaForex.it (translator option in many languages) full of free indicators, strategies and unique resources!

By registering through these links you get preferential assistance, various free resources and the possibility of free access to the VIP signal room. Clear cookies before visiting a broker. Send your ID, teh identification number that the broker assigns you, to info@freebinaryoptions.one.

Risk warning: "Binary options are not promoted or sold to retail EEA traders" If  the broker is not authorized in your area, e.g. IQ Option  (Eurozone / Usa), you can choose from our Broker Comparison (reliable brokers who accept traders from all over the world, following image):


DOUBLE MOVING AVERAGES

CROSSING OF TWO MOVING AVERAGES

After the article dedicated to how to implement a strategy based on a moving average , this time we evaluate whether two moving averages further improve our method.

Let’s see how to use the crossing of two EMA averages, setting the correct parameters and identifying the moment of opening the position.

In the past, we had already produced a large service on the subject of the two averages and their intersection, to which we refer you for further information.
IQ Option is sharing a tutorial on this topic. We have resumed it in our own words, without invitations to trade or advertising. We will also review some technical concepts.

The previous moving average tutorial demonstrates how easy and practical it is to use. Let’s see what happens by applying two moving averages, how to set them and when to receive a signal to open a position.
According to what we read in various technical articles, two averages should give more precise results. Let’s see in this article.
The average indicator is based on the calculation of the average price on the chart, obtained by setting a suitable time period. With two indicators (two MAs), therefore two averages adjusted over different periods, it may be possible to evaluate more precisely when to make trading decisions.


Let’s go back to the concept of Mobile Media.
The Moving Average indicator indicates the direction of an asset’s price.

The average is measured according to the number of candles considered, calculating the average of their closing values.
Example, an average calculated over 5 candles divides the closing values ​​by 5.

If the graph goes ahead by a new candle, the indicator will redo the calculation on the most recent 5 candles, and so on, drawing a line in the graph based on the values ​​obtained, which therefore indicates the current trend.

If we increase the number of candles taken into consideration, the sensitivity decreases, but the delay of the graph increases.

The intersection of two averages each based on different candle intervals (periods) helps to evaluate any trend reversals.

Instead of the simple moving averages seen here we will use exponential moving averages , which operate mainly considering the most recent values. If you want to know more, look for the complete definition and meaning.

The double moving average
The method involves two exponential moving averages (EMA) set with two different periods: 100 and 14 . Thus the trader trades with a highly adaptive 100 EMA, which reflects the market movement on a larger scale, and a faster 14 EMA, which reacts to the short-term trend.

SETTINGS
First look for the indicator in your broker’s charting platform list. The averages are present in practically all the trading room.

For example on Pocket Option :

CHANGE THE PERIOD ACCORDING TO THE INDICATIONS OF THE STRATEGY

About IQ Option:

In our technique we will have to enter two averages . Select the type of average, EMA, with a period of 14 and another with a period of 100 . Change the color of the line, for better viewing.
Same settings regardless of the selected time frame.

RULES FOR POSITION OPEN SIGNALS

Sell ​​signal (PUT) (example on Pocket Option chart above). The 14 EMA is above the 100 EMA and they cross each other. After the crossing the EMA 14 is below the EMA 100. Wait for a retest of the chart and open the position at the close of the first red candle:

Purchase signal (CALL) , in case of opposite situation (example in IQ Option chart).

After the crossing, the EMA 14 is above 100. Before entering, wait for the price to retest the EMA 14.
Entry at the close of the first green candle:

THE PRICE RETESTS, CLOSING FIRST GREEN CANDLE

In conclusion, the double moving average crossing strategy requires minimal setup, but is able to offer the trader a lot of information on the direction of the trend. Always make your own experiences in demo first. Happy trading.

We remind you to read/participate in the discussions on Telegram channels:

Broker No-Esma: https://t.me/BrokerNoEsma

Pocket Option Italia: https://t.me/PocketOptionItalia

_____________________________

Questions about trading? Try AI, Artificial Intelligence
(Robot bottom right)

Below you can see the brokers most used by our traders.  they have been selected based on the number of registrations and trading operations. In addition to these, you can view the complete list of brokers with relative comparison.

Go to the list

Visit our Italian website ForzaForex.it (translator option in many languages) full of free indicators, strategies and unique resources!

By registering through these links you get preferential assistance, various free resources and the possibility of free access to the VIP signal room. Clear cookies before visiting a broker. Send your ID, teh identification number that the broker assigns you, to info@freebinaryoptions.one.

Risk warning: "Binary options are not promoted or sold to retail EEA traders" If  the broker is not authorized in your area, e.g. IQ Option  (Eurozone / Usa), you can choose from our Broker Comparison (reliable brokers who accept traders from all over the world, following image):


MOVING AVERAGE STRATEGY

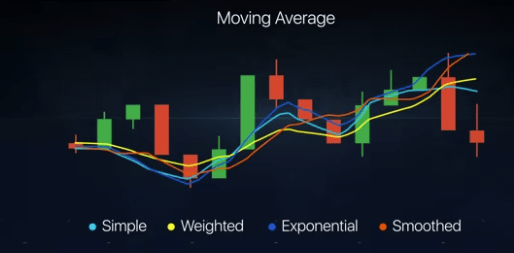
MOVING AVERAGE STRATEGY

Does it still make sense to use it?

Does it give hints about the future?

Are prices bouncing?

Why is it called moving?

How are the parameters adjusted?


Answers to these and other questions in this article.

Memorandum. What is a Moving Average?


The moving average (also called “MA” from the English Moving Average) is an average of the prices over a specific period of time. It is often used by traders to view the price movements of an asset as it “filters” sudden swings.


How is it calculated.
A moving average is calculated on candlestick data over a number of days. A 30-day moving average will require data over those 30 days, such as 30 one-day candles. Add the values ​​of the 30 days and divide the result by 30.
It is called “floating” because the appearance of new candlesticks modifies the overall data and changes the graph line.


The moving average is one of the most commonly used tools by traders, alone or in addition to other indicators.
If you decide to use it alone you can think about exploiting the bounce on the line with a strategy on the bounces that we offer you to discover trading opportunities.


To understand how the rebound on the moving average line works, think of asset prices that fluctuate continuously within a certain range, with an upward or downward trend.
The strategy consists in identifying the phases in which prices enter a strong trend , and then move back towards the moving average. In this case they tend to bounce off the line and then resume their previous direction.


Settings.
We use an exponential average (EMA) to smooth out recent swings, showing the general direction of the trend. We set at 34 periods and use candlestick charts with intervals of 1 to 5 minutes. We can receive with this system several daily signals.
Naturally it is possible to modify the parameters according to your needs, remembering that the greater the period of the indicator, the more fluid the line will be , and vice versa.

Moving Average Settings


How and when to open a position.
Call entry (purchase).

  1. The price chart is trending up, moving further away from the exponential moving average.
  2. The price then reverses, falling towards the indicator line and touching it, or falling slightly below it.
  3. If the following candle fails to close below the line and the price breaks above the indicator, this can be considered an entry signal.


In the example above, the graph moves up, then reverses and touches the indicator , bouncing in the same direction. The timing of the bounce could indicate a possible entry for a Call trade.

An example also for the condition Put (sale).

Let’s go over some practical theory.


What is a Moving Average?
The moving average (also called “MA” from English Moving Average) is an average of the prices over a specific period of time. It is often used by traders to view the price movements of an asset as it “filters” sudden swings.
How is it calculated.
A moving average is calculated on candlestick data over a number of days. A 30-day moving average will require data over those 30 days, such as 30 one-day candles each. Add the values ​​of the 30 days and divide the result by 30.
It is called “floating” because the appearance of new candlesticks modifies the overall data and changes the graph line.

We also did an article on crossing two moving averages

We remind you to read/participate in the discussions on Telegram channels:

Broker No-Esma:  https://t.me/BrokerNoEsma

Pocket Option Italia:  https://t.me/PocketOptionItalia

_____________________________

Questions about trading? Try AI, Artificial Intelligence
(Robot bottom right)

Below you can see the brokers most used by our traders.  they have been selected based on the number of registrations and trading operations. In addition to these, you can view the complete list of brokers with relative comparison.

Go to the list

Visit our Italian website ForzaForex.it (translator option in many languages) full of free indicators, strategies and unique resources!

By registering through these links you get preferential assistance, various free resources and the possibility of free access to the VIP signal room. Clear cookies before visiting a broker. Send your ID, teh identification number that the broker assigns you, to info@freebinaryoptions.one.

Risk warning: "Binary options are not promoted or sold to retail EEA traders" If  the broker is not authorized in your area, e.g. IQ Option  (Eurozone / Usa), you can choose from our Broker Comparison (reliable brokers who accept traders from all over the world, following image):


GOwithGREEN: Auto-Trading Without Robot

“GOwithGREEN” Auto-Open position: without robot or broker’s authorizations

Here is an example of a trading session without manual operator intervention. Automatism will accomplish this by itself, awaiting for the appropriate conditions to open your trade accordingly.

The method involves acquiring an entrance opening by taking advantage of the delay in updating the broker’s platform.

The automatism “sees” the sudden movement of a candle or spike and opens the operation in a fraction of a second.

The broker will follow in the same direction and our operation will take the lead. Of course should the market’s movement be tumultuous, its direction would be possible to lose, but the odds are within favor of the trader.

Someone will remember an old program launched by ForzaForex.it, called “VaiColVerde”, Go with Green is the English version.

Well, this GOwithGREEN is nothing more than an update of the same method, made by FreeBinaryOptions.one

Download the PDF

Download the complete PDF attached to the system (download button at the end of the page). In this way you will understand how it works, and why not, if you have the time and desire, you can also make it yourself.

Otherwise, keep on reading the tutorial that follows, even if less detailed than the PDF.


What’s Needed

  • The MT4 “Big Body Arrows” indicator. The indicator was created by Forzaforex.it for this type of operation.
  • A broker with an account opened under the Forzaforex.it link. In this case CryptoBO (but nothing prevents you from using a different broker, provided that it has some kind of delay in updating data).
  • An autoclicker, in this case the one supplied with GOwithGREEN. It is also found online, but it is paid. This is what is needed in our case. It has been purchased by Forzaforex.it and it is already included in the system’s package.
  • A MT4 with the assets we intend to use (e.g. BTC / USD) possibly open on weekends.
  • An expert indicator for obtaining an MT4 with time frame in seconds.
  • A small program that always keeps windows in evidence.
  • The PDF with detailed instructions.

All the files you need are included in the GOwithGREEN package, which also features a video tutorial to better understand.

No authorization from the broker, API, bot etc. is required. Everything happens in the desktop, as if the trader were operating manually.


  • GOwithGREEN autoclicker window
    GOwithGREEN autoclicker window

How Does it Work

  • Prepare an MT4 with time frame in seconds. “How to do it” is described in the tutorial  https://www.freebinaryoptions.one/custom-time-frame-metatrader/  but it is also reported within the system GwG PDF itself.
  • MT4 and the broker’s platform must be placed in the same window, without clicking on one of the two. Logically you set Asset, amount and maturity. The broker’s time frame doesn’t matter, but MT4’s does.
  • The autoclicker is activated with the images you need, those of the pop-up and the Call / Put buttons. The method is illustrated in the video.
  • The sequence is as follows: the indicator makes a pop-up appear upon entry. The autoclick “sees” it and clicks Call or Put according to the content of the pop-up.
    Once completed, the system will operate all by itself. Here’s what the trading window looks like:

VIDEO TUTORIAL

Automatic trading with the “GOwithGREEN” autoclicker

How to get the full Autotrading System

Two options:

Purchase at the promotional introductory price $49:

(Click the logo or scan the code)

Buy Now and Download


This image has an empty alt attribute; its file name is PayPal.svg_.png

If you only have paypal, request a payment by email to forzaforex@gmail.com


Free. Minimum deposit of the same amount on the broker’s account opened under our link. The list is on the home page (broker comparison). Send your new ID Broker Client to: info@freebinaryoptions.one

(Note:Delete the cookies before visiting the broker)

FREE DOWNLOAD PDF TUTORIAL GOwithGREEN Autotrading System


_____________________________

Questions about trading? Try AI, Artificial Intelligence
(Robot bottom right)

Below you can see the brokers most used by our traders.  they have been selected based on the number of registrations and trading operations. In addition to these, you can view the complete list of brokers with relative comparison.

Go to the list

Visit our Italian website ForzaForex.it (translator option in many languages) full of free indicators, strategies and unique resources!

By registering through these links you get preferential assistance, various free resources and the possibility of free access to the VIP signal room. Clear cookies before visiting a broker. Send your ID, teh identification number that the broker assigns you, to info@freebinaryoptions.one.

Risk warning: "Binary options are not promoted or sold to retail EEA traders" If  the broker is not authorized in your area, e.g. IQ Option  (Eurozone / Usa), you can choose from our Broker Comparison (reliable brokers who accept traders from all over the world, following image):