Swing Trading: The useful strategy for beginners and experts
You will know that brokers offer trading strategies from time to time through their newsletters.
Of course brokers are always biased, but often their information can be used to our advantage by stripping it of superfluous bits.
This time we talk about ” Swing Trading “, a technique useful for beginners but also for experienced traders.
What is Swing Trading?
With this technique the trader tries to capture the market swings as the price of the asset fluctuates over short, intermediate or long-term time intervals. Compared to “Day Trading”, in swing trading operations can be opened and closed within a limited period of time.

To anticipate swings, the trader often uses technical analysis. Analyzing price charts and patterns can help you identify early signs of potential swings and catch the optimal time to enter a trade.
You can use a variety of different tools for technical analysis.
Here are some basic technical analysis tools you can consider for your swing trading approach.
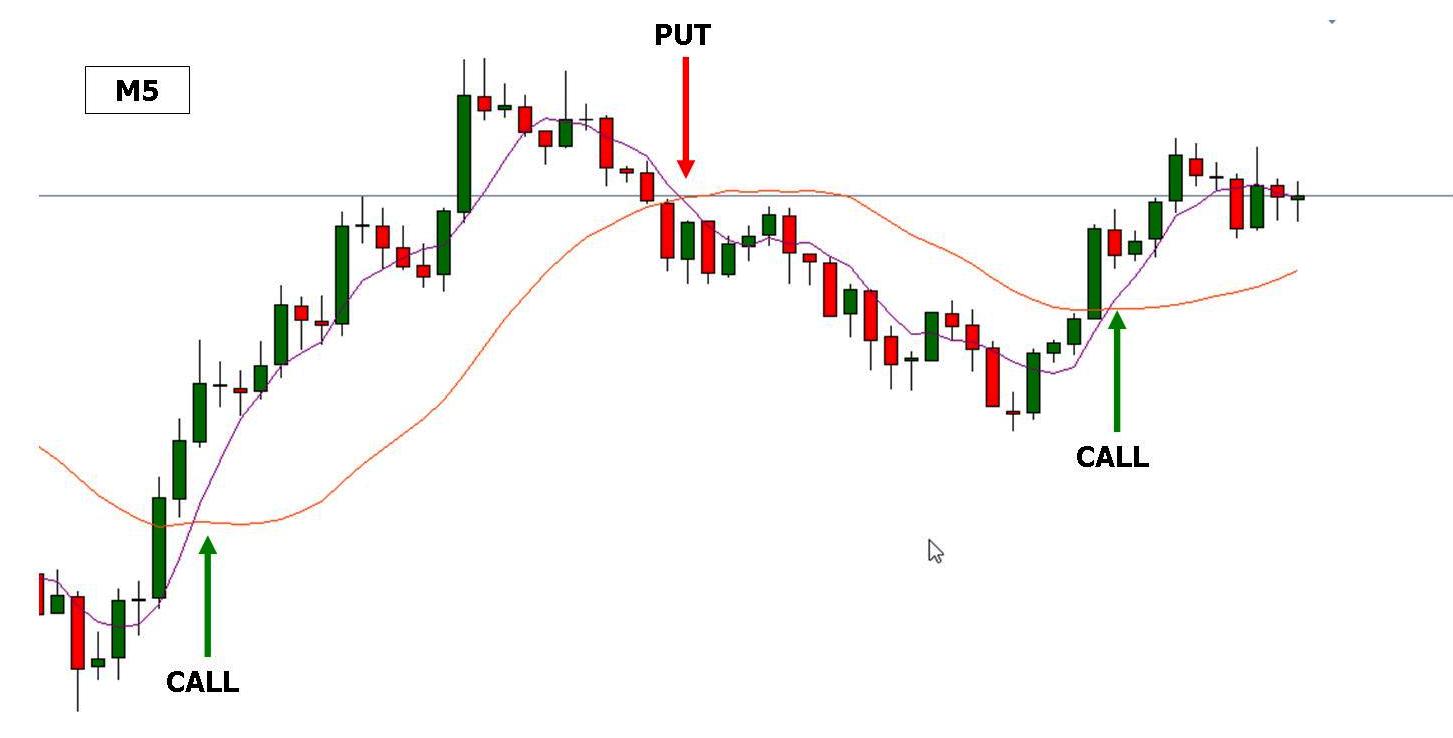
- The Moving Average (MA): A popular tool for identifying trend direction.
- The patterns of the candles : the combinations of the candles form an upward or downward pattern.
- The convergence divergence of oscillatory indicators, such as Stochastics, MACD, RSI. A powerful indicator for spotting emerging trends.
- Fibonacci retracements : horizontal lines used to determine support and resistance levels.